
Dashboard handbook
A disciplined way to read the market.
Move from broad market context to a focused, risk-aware review. This handbook explains which widget to open, the question it answers, what must be confirmed next, and when conflicting evidence means you should pause.
Before your first review
Make the evidence comparable.
A useful review starts with consistent inputs. Complete these checks before interpreting direction or strength.
Check freshness
Read the latest timestamp, data age, and synchronization status. Stale evidence can be technically correct but operationally irrelevant.
Match the context
Keep the symbol, timeframe, timezone, and observation window consistent while comparing widgets.
Start at 15 minutes or above
Standard access supports 15-minute and higher timeframes. Use an adjacent higher timeframe to test whether the shorter view agrees with broader structure.
Define risk first
Know the invalidation level, acceptable loss, and required reward-to-risk before treating a candidate as actionable.
End-to-end operating workflow
Start broad. Narrow the evidence. Confirm the risk.
Follow the same sequence for every symbol. Skipping directly to one attractive indicator increases the chance of acting on noise.
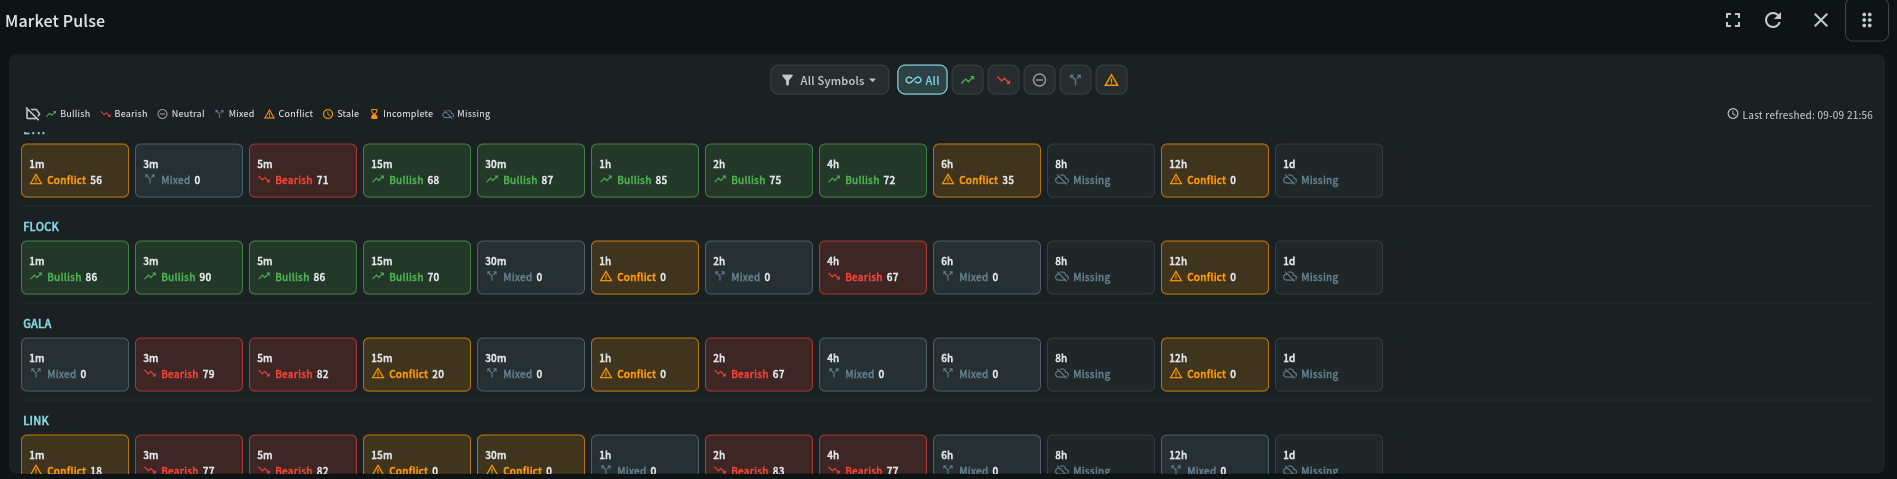
Market Pulse
Open guide- Question
- Is the wider market leaning bullish, bearish, neutral, or mixed?
- Review
- Review breadth, direction counts, and freshness. Treat a mixed pulse as a reason to demand stronger symbol-level evidence.
- Continue when
- The broad environment is understood and the data is current.
Scanner Signals
Open guide- Question
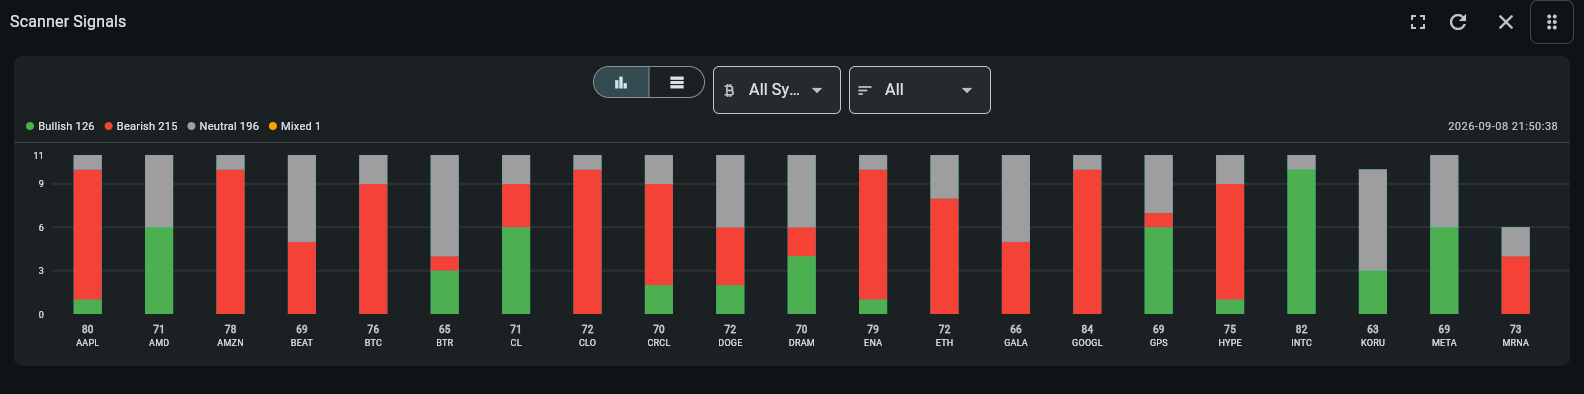
- Which symbols deserve attention now?
- Review
- Use the ranked summary to find candidates, then compare confidence and the distribution of bullish, bearish, and neutral states.
- Continue when
- A candidate stands out for evidence—not merely because it is first in the list.
Scanner Signal Insights
Open guide- Question
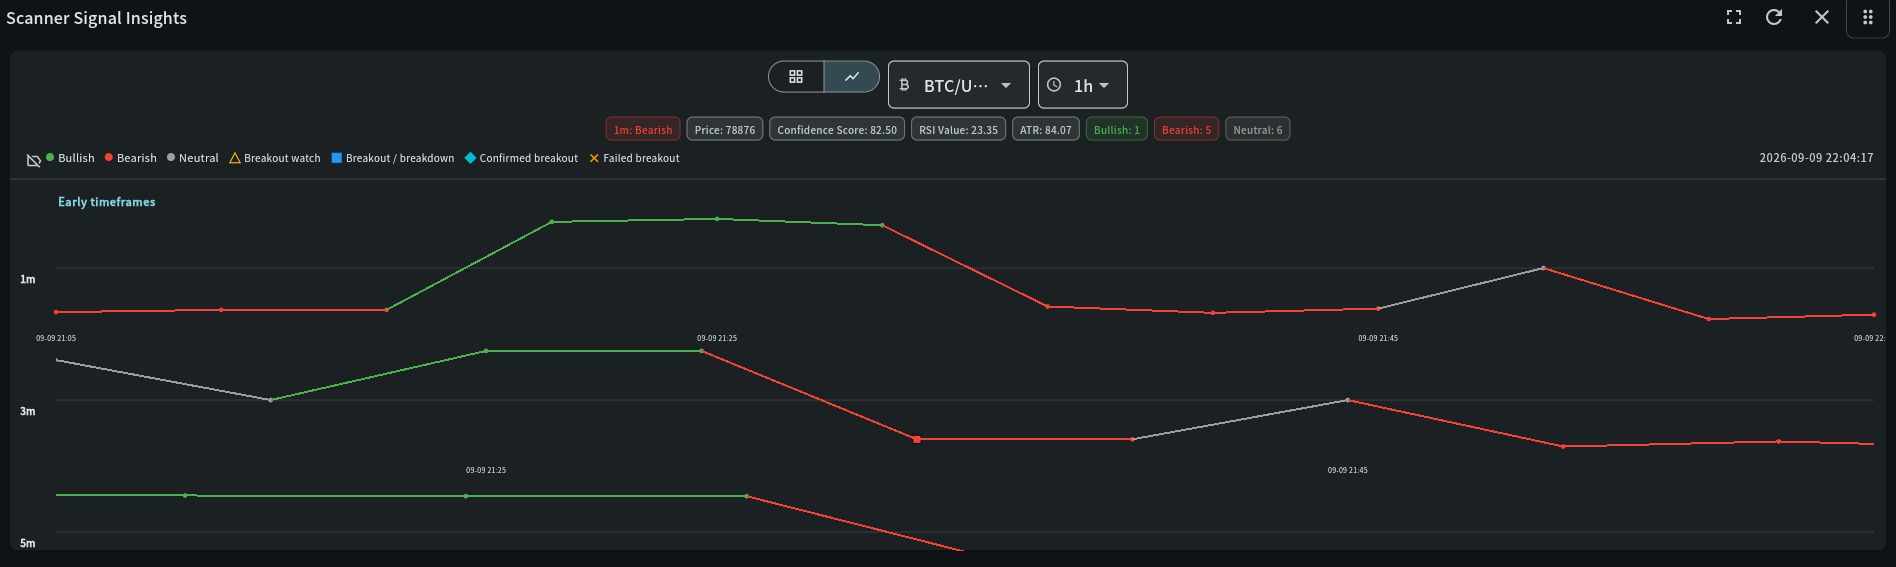
- Is the candidate persistent across its timeframe lanes?
- Review
- Inspect lane history, direction changes, early warnings, and breakout progression. A single isolated point is weaker than a state that persists.
- Continue when
- Recent observations and adjacent lanes remain coherent.
Scanner Intelligence
Open guide- Question
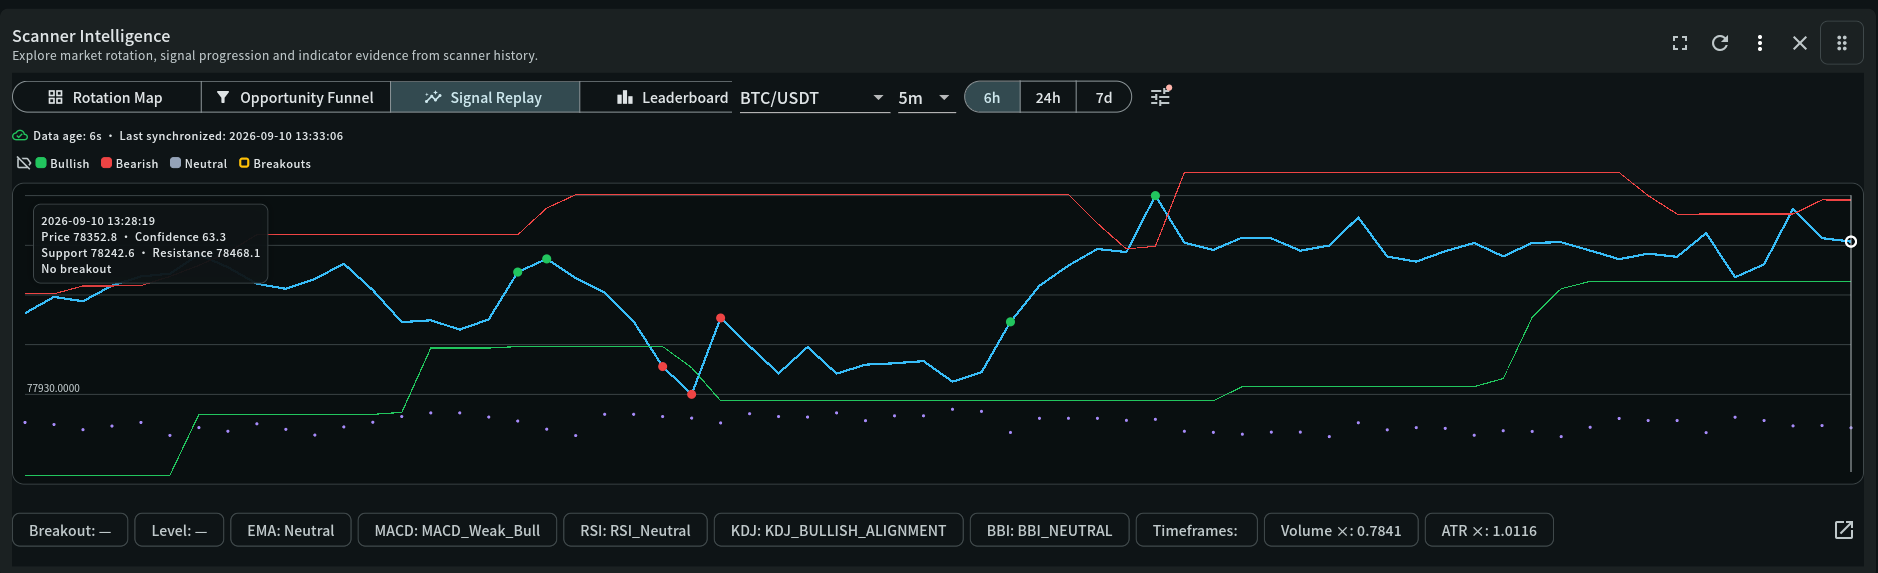
- How mature is the signal, and what evidence produced it?
- Review
- Follow Early Warning → Breakout Watch → Replay Evidence → Multi-Timeframe Confluence → Confirmed Breakout. Open the evidence panel instead of relying on the label alone.
- Continue when
- Replay evidence, contributing indicators, and eligible timeframes support the same interpretation.
Strategic Opportunity Insights
Open guide- Question
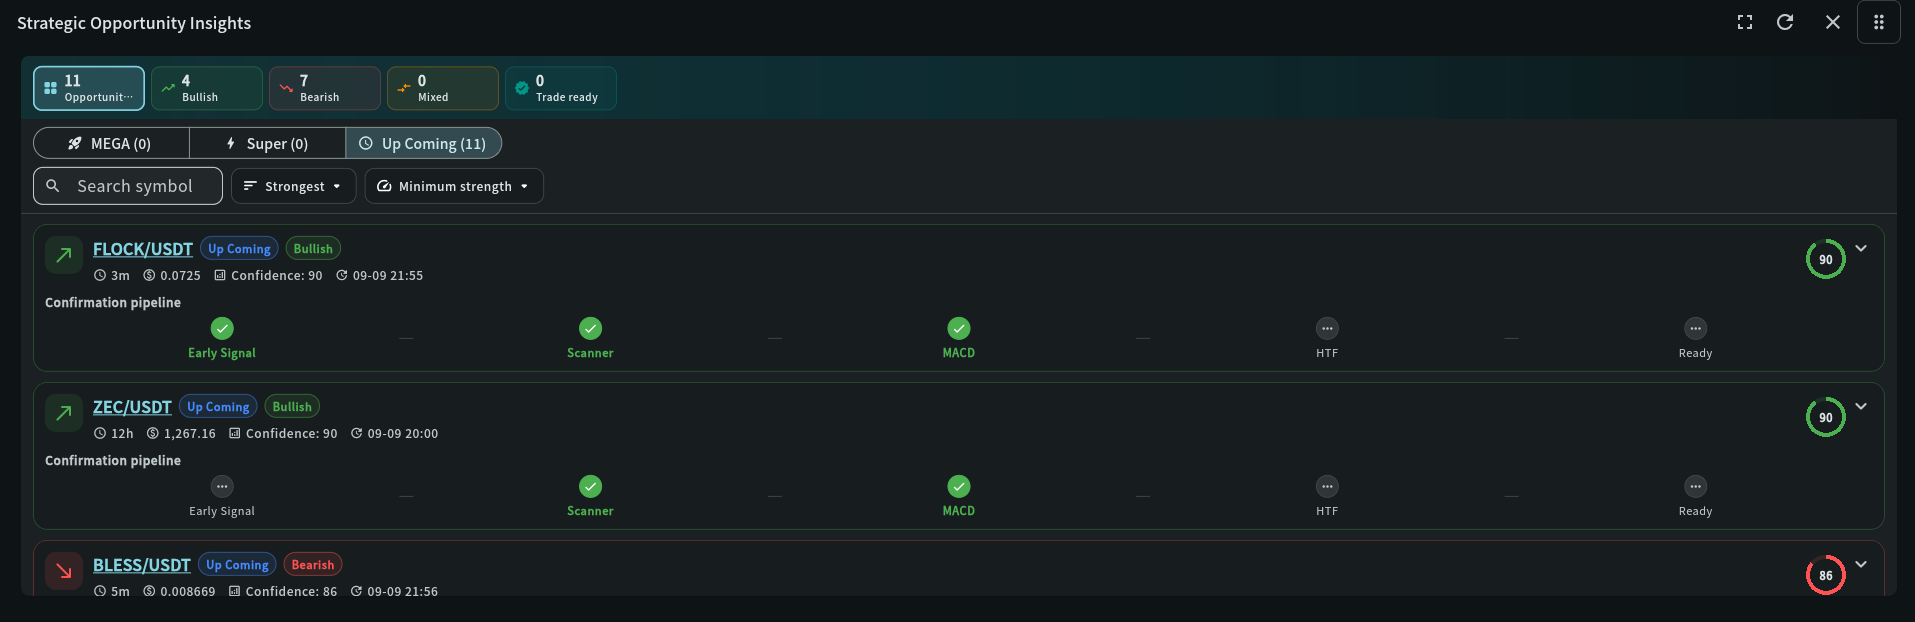
- Which candidates have the strongest cross-source agreement?
- Review
- Filter bullish, bearish, mixed, or confirmed-setup candidates and compare supporting with opposing confirmations. Use ranking to prioritise research, not as an instruction.
- Continue when
- Independent sources agree and material opposing evidence has been examined.
MACD Signal Insights
Open guide- Question
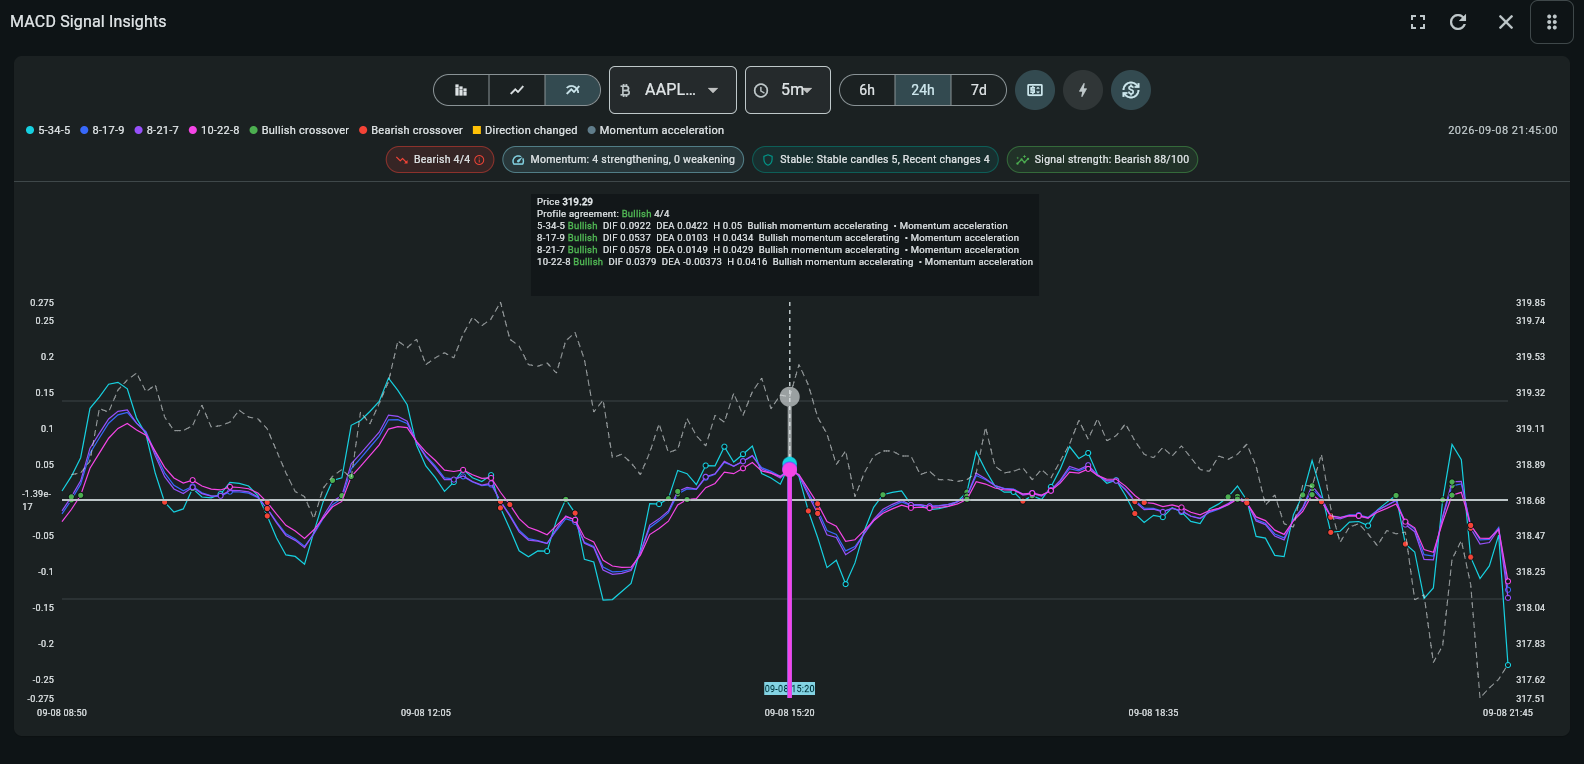
- Is momentum developing, stable, weakening, or reversing?
- Review
- Compare profile agreement, lead/lag order, histogram acceleration, crossovers, and the price overlay. Check whether slower profiles confirm the fast profile.
- Continue when
- Momentum persists beyond one crossover and agrees with the selected timeframe context.
Price / OI Insights
Open guide- Question
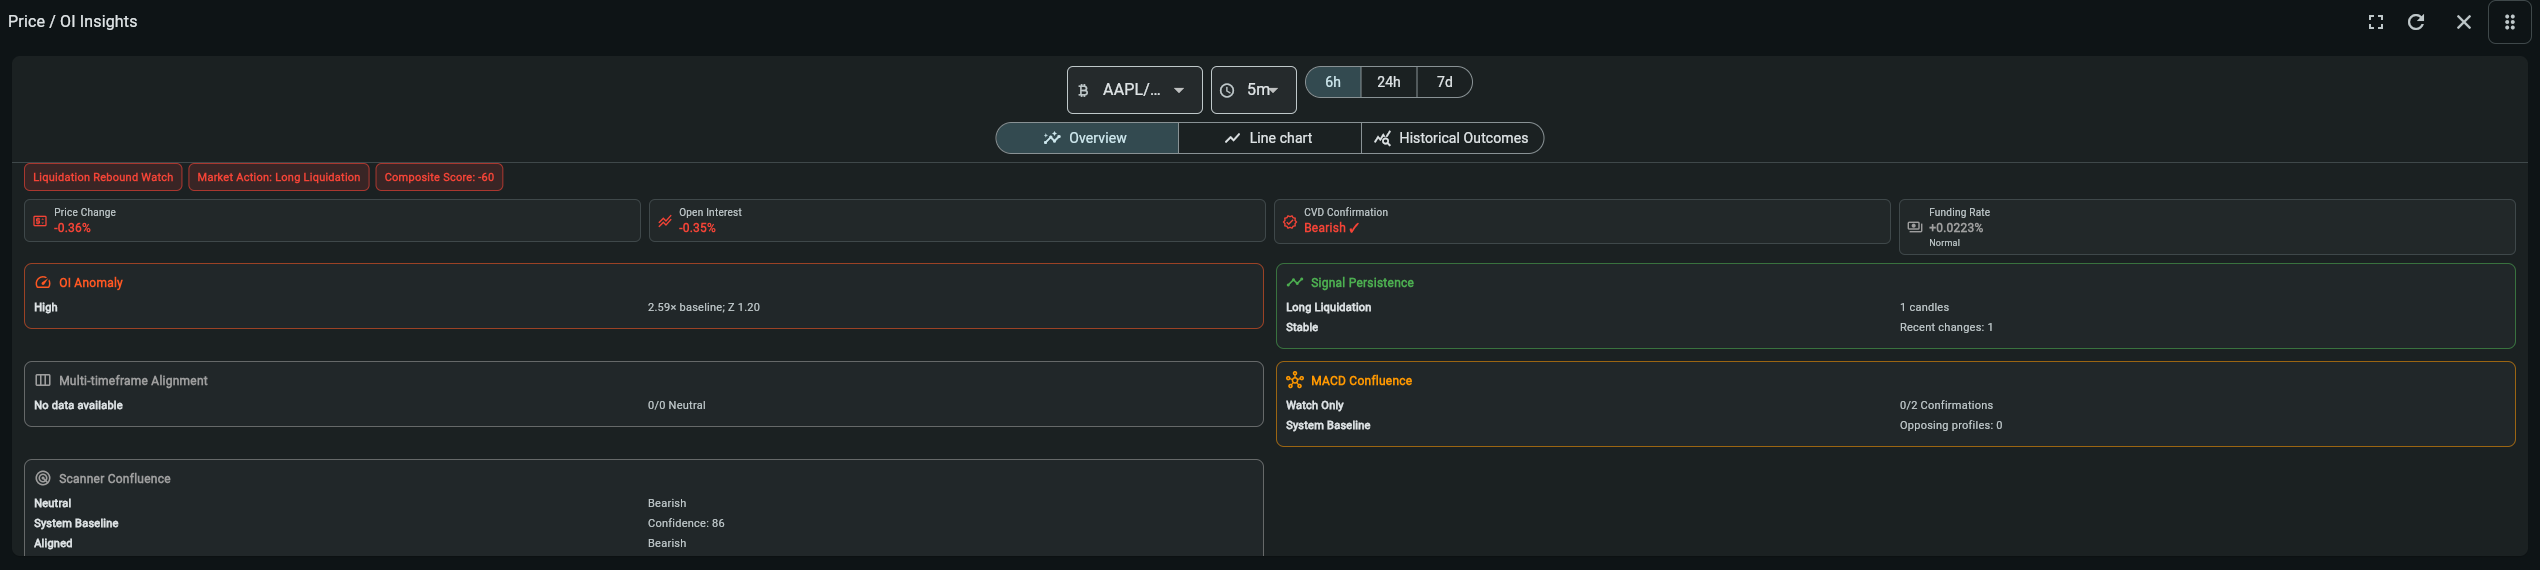
- Does participation support the price move?
- Review
- Compare price direction with open-interest direction. Rising price with rising OI suggests expanding participation; divergence or falling OI calls for caution.
- Continue when
- Participation behaviour is consistent with the proposed interpretation.
Price Action Insights
Open guide- Question
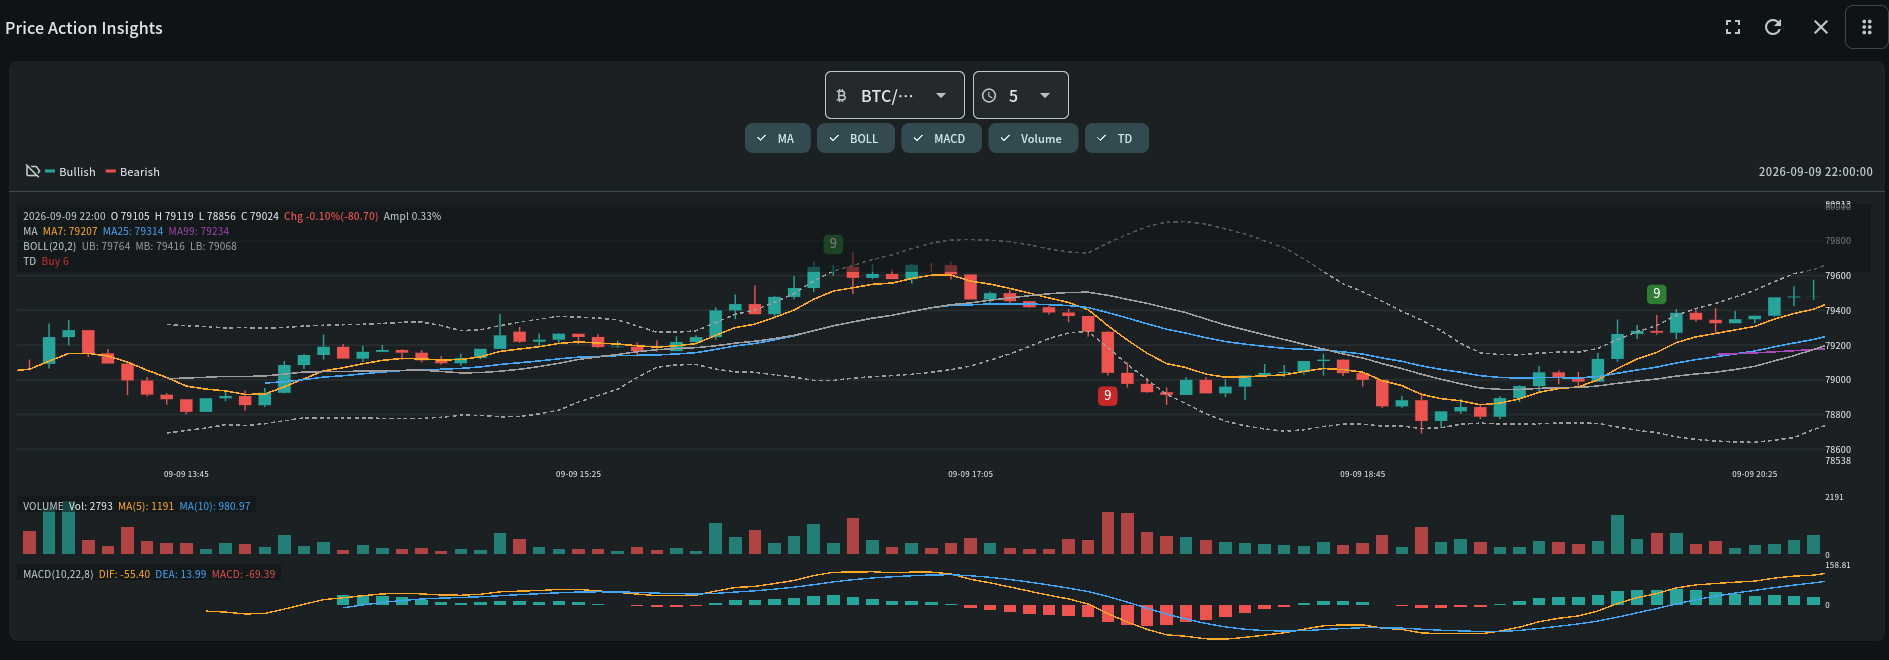
- Where are structure, invalidation, and volatility?
- Review
- Review support, resistance, candles, volume, Bollinger context, MACD, and TD 9/13. TD is exhaustion or continuation context—not a standalone reversal order.
- Continue when
- The decision area, invalidation, liquidity, volatility, and reward-to-risk can be stated clearly.
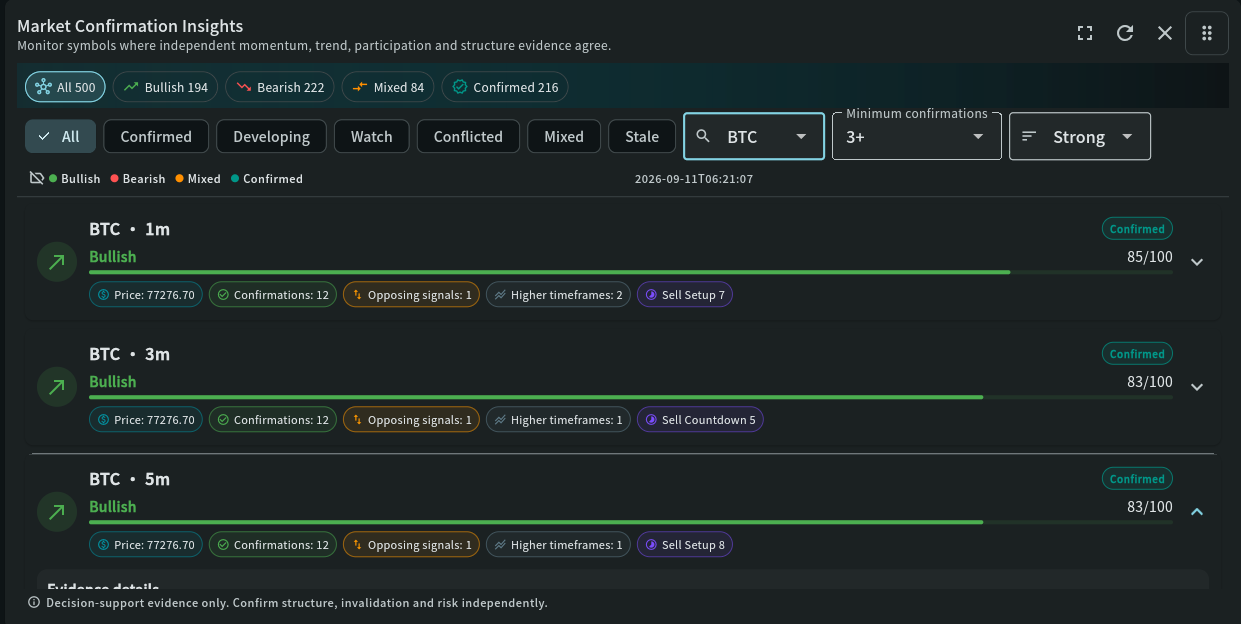
Market Confirmation Insights
Open guide- Question
- Do independent sources confirm or contradict the candidate?
- Review
- Read bullish and bearish scores, confirmation count, freshness, higher-timeframe context, and every evidence row. Investigate conflicts before deciding.
- Continue when
- The combined case is current, sufficiently confirmed, and compatible with your risk plan.
Decision checkpoint
Seven questions before any independent decision
A candidate is not ready merely because one widget is green or red. Use this gate at the end of every review.
Is every important source recent enough for the selected timeframe?
Does broad market context support the direction—or have I accounted for the conflict?
Has the symbol-level signal persisted rather than appearing once?
Do the selected and adjacent higher timeframes agree?
Do price structure, volume, and participation support the move?
Have opposing evidence and exhaustion risk been inspected?
Are invalidation, position size, and reward-to-risk defined independently?
Practical examples
Apply the same process in either direction.
Bullish candidate
- Market Pulse is supportive or at least not strongly bearish.
- Scanner history progresses from early warning toward confirmation and remains fresh.
- MACD profiles strengthen in a sensible lead/lag sequence; price and OI show constructive participation.
- Price holds above a relevant level with supportive volume and clear invalidation below structure.
- Market Confirmation Insights shows stronger bullish evidence without an unresolved material conflict.
Bearish candidate
- Market Pulse is weak or at least not strongly bullish.
- Scanner history shows bearish progression or a confirmed breakdown across eligible timeframes.
- MACD profiles weaken coherently; price and OI do not contradict the bearish thesis.
- Price loses support with adequate participation, while invalidation above structure is explicit.
- Market Confirmation Insights shows stronger bearish evidence and any TD exhaustion warning is considered.
When widgets disagree
Disagreement is information. It often appears during transition, low participation, or when short and higher timeframes describe different phases.
- Check timestamps first; one source may be older.
- Align symbol, timeframe, and window before comparing values.
- Give structure and higher-timeframe context more weight than one fast crossover.
- Reduce confidence when price/OI, volume, or breadth does not confirm momentum.
- Wait for the next closed candle instead of resolving ambiguity by assumption.
Practical discipline
Use a repeatable session routine.
Before and during the session
- Confirm timezone and market session.
- Review Market Pulse before individual symbols.
- Create a shortlist rather than monitoring every symbol equally.
- Record why a candidate qualifies and what would invalidate it.
- Refresh deliberately; frequent refreshing is not stronger evidence.
After the session
- Review whether the original evidence persisted or failed.
- Separate process quality from profit or loss.
- Note which source disagreed first and whether it warned usefully.
- Compare candidates using the same timeframe and criteria.
- Refine a written checklist—not the indicators after every outcome.
Common mistakes to avoid
A green or red state is a classification, not a complete decision.
A 15-minute move and a four-hour structure can both be valid while describing different phases.
Old confirmations must not be treated as current participation.
Several MACD fields are related; seek confirmation from independent structure and participation sources.
TD 9/13 provides exhaustion or continuation context and must be confirmed elsewhere.
Define risk before the decision and preserve the reasoning for review.
Market-specific context
Apply the workflow differently to crypto and stocks.
Cryptocurrency markets
Crypto trades continuously, session boundaries are less obvious, and weekend liquidity can differ materially. Check data age, liquidity, volatility, funding/open-interest context, and higher-timeframe structure before relying on a short intraday move.
Stock markets
Exchange hours, pre-market and after-hours activity, opening gaps, earnings, corporate actions, and index conditions can dominate technical signals. Confirm that the symbol is in an active session and account for event risk.
Reference library
Open the detailed guide for any widget.
Each guide explains visible fields, controls, workflow, and interpretation. Standard access is free, supports timeframes from 15 minutes onward, and allows up to five approved catalog coins.
Public market-analysis features
Trends InfoBrowse the current state tables, including trend, MACD, scanner, strategy, and market-collapse information.→Price / OI InsightsCompare price and open-interest states to identify participation changes around market moves.→Strategic Opportunity InsightsSurface MEGA, Super, and Up Coming opportunities from scanner and higher-timeframe confirmations.→Scanner SignalsCompare bullish, bearish, neutral, and mixed scanner sentiment per symbol as a sortable bar chart or ranked table.→Scanner Signal InsightsRead a concise event timeline of scanner trend changes, indicator tags, price, ATR, and RSI context.→Market PulseSee group-aware Trend/MACD alignment for each symbol and timeframe with bullish, bearish, neutral, mixed, and conflict filters.→MACD Signal InsightsConnect market breadth, signal events, configured MACD profiles, price context, crossovers, stability, and strength on one timeline.→Price Action InsightsVisualise price movement as candlesticks with moving average, Bollinger Bands, MACD, volume, and TD Sequential overlays.→Scanner IntelligenceInvestigate market rotation, opportunity progression, multi-timeframe confluence, replay evidence, and measured trade outcomes in one connected workspace.→Market Confirmation InsightsRank symbols where independent scanner, momentum, trend, participation, structure, and higher-timeframe evidence agree—and expose conflicts before a decision is made.→Core principle
Evidence supports a decision; it does not make one.
My Coin Trends provides market information and technical analysis, not investment advice or a guarantee of performance. Use current data, independent judgment, and risk controls appropriate to your circumstances.