
Features Standard

Price / OI Insights

Compare price and open-interest states to identify participation changes around market moves.

Availability

Standard

Use this widget with its linked state records, your selected timezone, and independent risk management. A signal or chart does not guarantee a trade outcome.

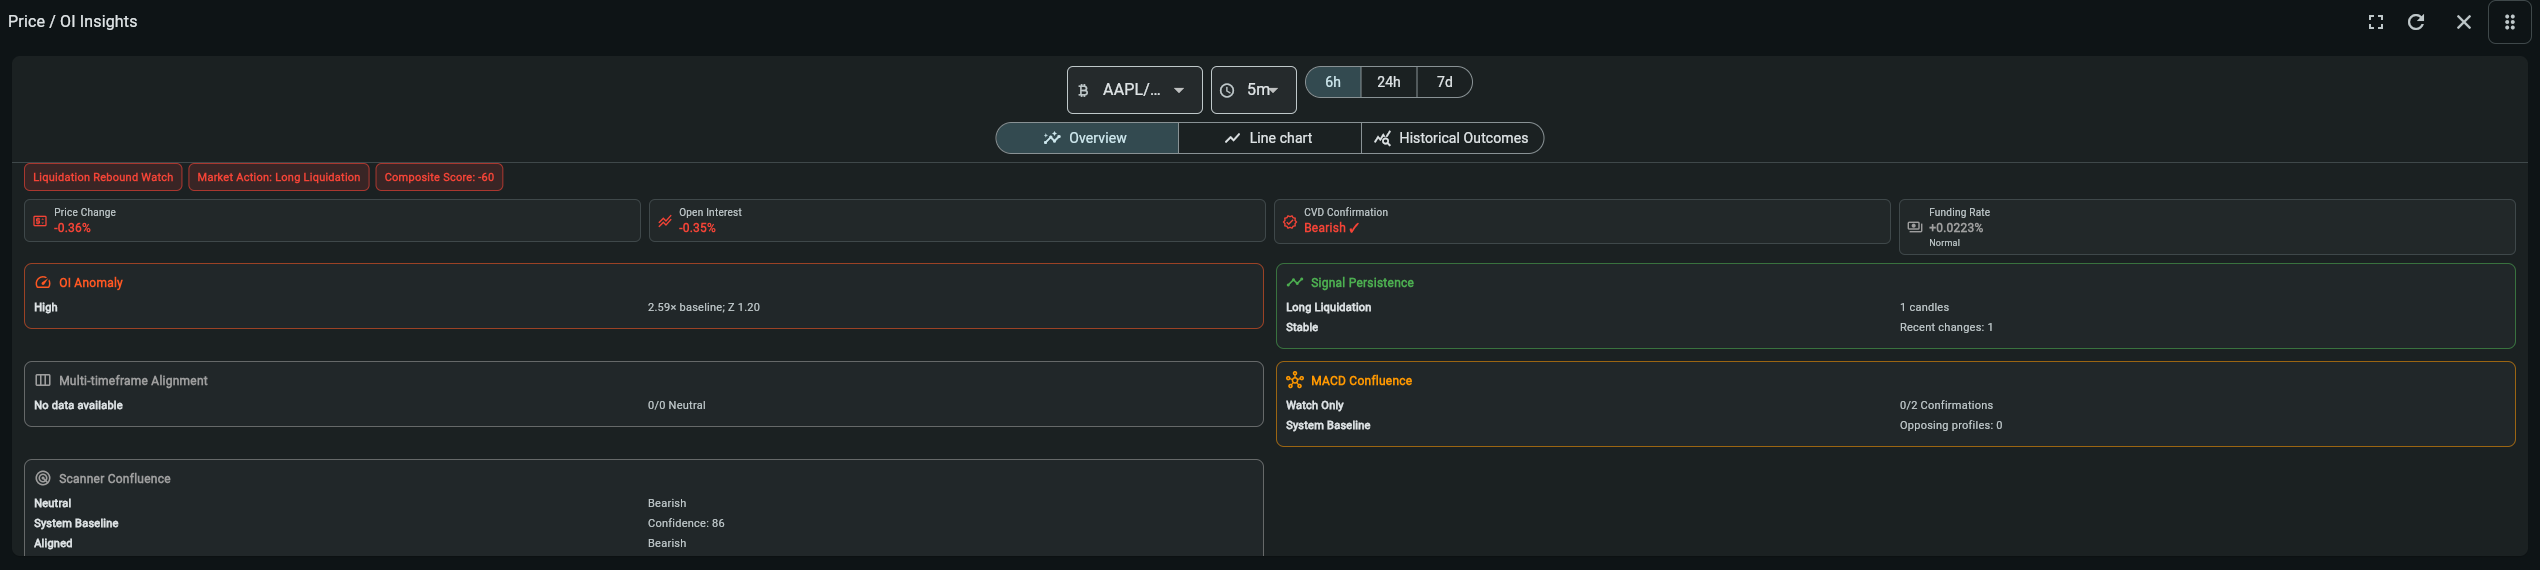
Price / OI Insights widget in the My Coin Trends dashboard

Step-by-step use

Price / OI Insights

Compare price and open-interest states to identify participation changes around market moves.

  1. 1
    1. Choose the view

    Add the widget from the Dashboard widget menu.

  2. 2
    2. Review the context

    Choose an available symbol and timeframe.

  3. 3
    3. Continue your review

    Use the timeline and tooltip values to compare price with open interest.

Recommended attention order

What to review first

Price and open interest become useful when read as a relationship. Establish the same window and timeframe, classify the price/OI combination, then seek independent confirmation.

Select symbol/timeframe/window → Compare price and OI → Classify participation → Check CVD/funding → Confirm with price action

  1. Set a comparable scope

    Choose one symbol, timeframe, and lookback window. Short windows react faster; longer windows reduce noise.

  2. Compare direction, not isolated lines

    Rising price with rising OI can indicate new participation; falling price with rising OI can indicate short buildup. Falling OI can indicate position closure.

  3. Judge persistence

    Look for a relationship that persists across several observations. A single spike can come from liquidation, rollover, or delayed data.

  4. Add positioning context

    Use CVD, funding, liquidation, and regime fields where available to test whether participation supports or contradicts the move.

  5. Confirm the market structure

    Open Price Action Insights and check support, resistance, volume, and volatility. Price/OI describes participation; it does not guarantee direction.

How to read this widget

Price / OI Insights

Use these points to interpret the visible values before moving to a related record or decision.

Price and OI lines

Compare the cyan price-change line with the amber open-interest-change line. Rising price with rising OI can indicate new participation; falling price with rising OI can indicate increasing short participation. Neither relationship predicts direction by itself.

State indicators

The status chips summarise the current price/OI relationship. Read CVD confirmation and funding rate as supporting context, not as independent entry signals.

Use the selected window

A short window is more reactive and a longer window smooths noise. Compare the same symbol and timeframe before deciding whether participation is strengthening or fading.

Field reference

What each value means

Use these definitions to interpret the widget consistently across cryptocurrency and stock markets.

FieldMeaningPractical use
Price changePercentage or normalized movement in the instrument price.Compare its direction with OI and volume rather than reading it alone.
Open interest (OI)Outstanding perpetual/futures contract exposure.Rising price + rising OI can indicate new participation; falling price + rising OI can indicate short buildup.
Funding ratePeriodic transfer between long and short perpetual positions.Extreme funding can flag crowded positioning; it is not a guaranteed reversal signal.
CVD / liquidation / regimeOrder-flow and forced-position context where available.Use as confirmation and risk context, especially around fast moves.

Cryptocurrency markets

This widget is most informative for derivatives markets with reliable OI and funding data; spot-only pairs may not provide the same fields.

Stock markets

Traditional stocks do not have exchange-wide OI or perpetual funding. Use volume, turnover, short interest, borrow cost, and options open interest as separate context instead.

Risk notice

My Coin Trends provides market information and technical signals. It is not investment advice. Verify every signal against current market structure, liquidity, and your own risk limits before making a trading decision.