Choose a view
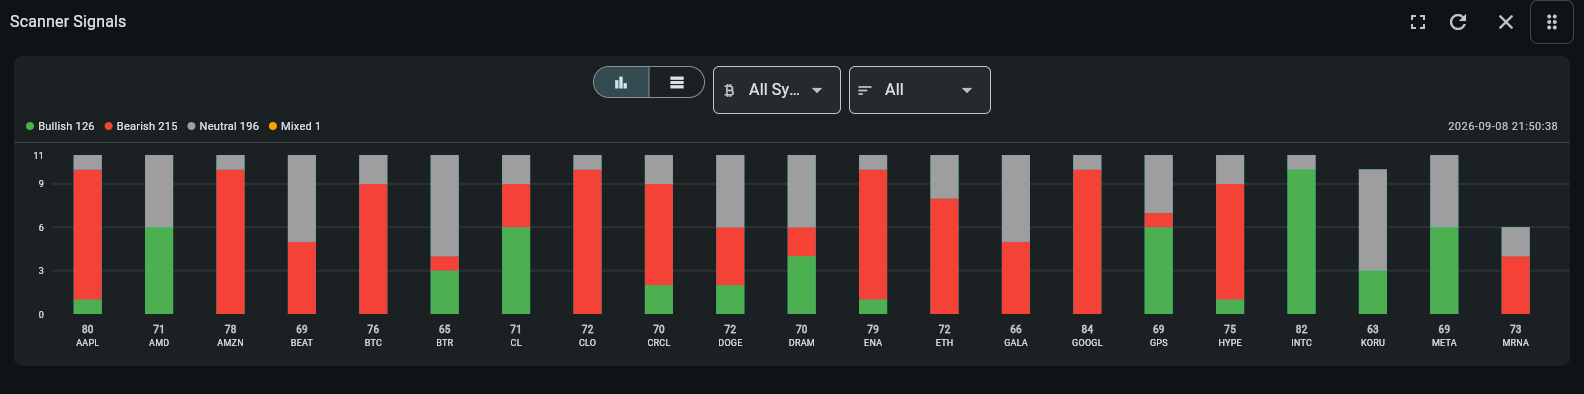
Bar compares bullish and bearish counts visually for each symbol; Table presents the same scanner summary as a compact ranked list for precise comparison.

Compare bullish, bearish, neutral, and mixed scanner sentiment per symbol as a sortable bar chart or ranked table.
Availability
StandardUse this widget with its linked state records, your selected timezone, and independent risk management. A signal or chart does not guarantee a trade outcome.
Step-by-step use
Compare bullish, bearish, neutral, and mixed scanner sentiment per symbol as a sortable bar chart or ranked table.
Open Scanner Signals from the navigation menu.
Switch between the Bar and Table views.
Filter or sort by All, Bullish, Bearish, Neutral, or Mixed to find the strongest relevant sentiment.
Recommended attention order
Scanner Signals is a market-ranking surface. Begin broadly, compare directional balance and sample composition, then drill into a symbol rather than acting on the largest bar.
Choose lookback → Filter direction → Compare net sentiment → Check timeframe distribution → Open detailed evidence
Select the relevant lookback and confirm the summary is fresh. A wider window contains more evidence but may include older conditions.
Use All, Bullish, Bearish, Neutral, or Mixed to isolate the type of candidate you want to investigate.
Read bullish and bearish counts together. Large counts on both sides can produce a weak or mixed net result.
Review timeframe distribution and sample size. Broad agreement is more meaningful than one heavily repeated fast timeframe.
Open Scanner Signal Insights or Scanner Intelligence for persistence, event evidence, and confluence. The ranked summary is a discovery tool.
How to read this widget
Use these points to interpret the visible values before moving to a related record or decision.
Bar compares bullish and bearish counts visually for each symbol; Table presents the same scanner summary as a compact ranked list for precise comparison.
A symbol with many bullish and many bearish observations can still have a small net sentiment. Compare the net figure, not just which colour looks larger.
This view summarises recent scanner output for one lookback window. Open the underlying signal before treating a strong reading as a reason to act.
Field reference
Use these definitions to interpret the widget consistently across cryptocurrency and stock markets.
| Field | Meaning | Practical use |
|---|---|---|
| Bullish / bearish / neutral count | Recent scanner observations grouped by directional state. | Compare net sentiment and sample size, not color alone. |
| Net sentiment | Bullish observations minus bearish observations. | Use to rank symbols, then open the underlying signal for details. |
| Timeframe distribution | Which intervals contributed to the summary. | Broad agreement is more useful than one isolated fast timeframe. |
Filter by liquidity and exclude symbols with thin order books or abnormal spreads before interpreting sentiment.
Filter by average dollar volume and regular-session behavior; a single gap can dominate a short lookback.
My Coin Trends provides market information and technical signals. It is not investment advice. Verify every signal against current market structure, liquidity, and your own risk limits before making a trading decision.