Choose the view for the question
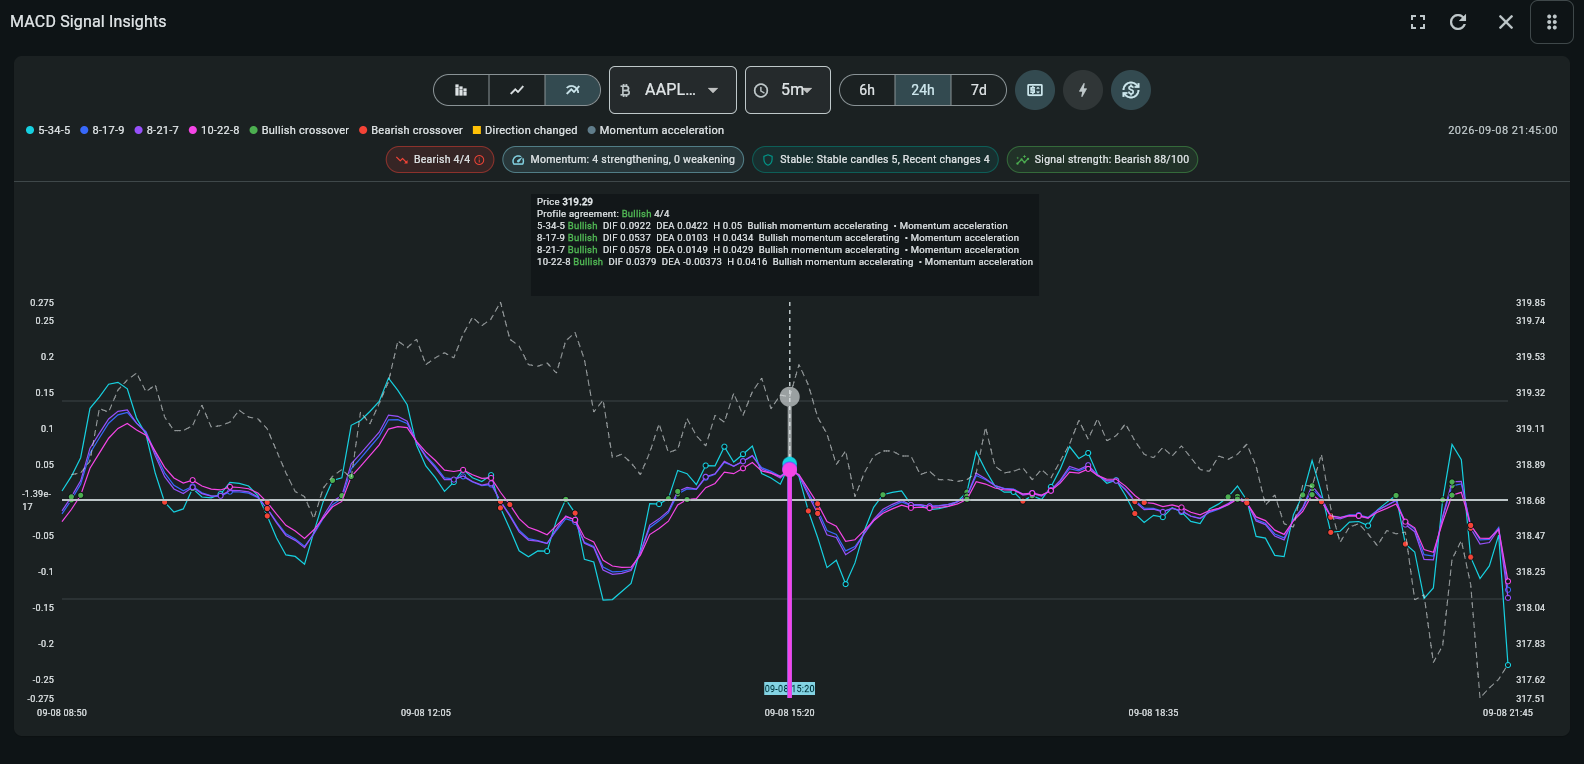
Market Breadth compares the distribution of scanner states. Signal Timeline follows one symbol through time. MACD Profiles compares each enabled profile without creating a second, duplicated chart.

Connect market breadth, signal events, configured MACD profiles, price context, crossovers, stability, and strength on one timeline.
Availability
StandardUse this widget with its linked state records, your selected timezone, and independent risk management. A signal or chart does not guarantee a trade outcome.
Step-by-step use
Connect market breadth, signal events, configured MACD profiles, price context, crossovers, stability, and strength on one timeline.
Choose Market Breadth, Signal Timeline, or MACD Profiles.
Set the symbol, timeframe, and lookback window before comparing values.
Use the optional price, event, divergence, and trade-outcome layers only when they answer your current question.
Recommended attention order
MACD Signal Insights should be read as momentum development, not as one crossover. Start with freshness and profile agreement, then evaluate acceleration, stability, events, and price context.
Choose view and timeframe → Profile agreement → Acceleration and stability → Crossover/direction change → Price and confluence confirmation
Use Market Breadth for distribution, Signal Timeline for one symbol, or MACD Profiles for profile comparison; then set symbol, timeframe, and lookback.
Broad stable agreement carries more weight than a single fast profile. Mixed profiles can indicate transition or noise.
Determine whether bullish or bearish momentum is strengthening or weakening and how long direction has persisted.
Review crossover, zero break, direction change, early watch, divergence, confirmation, and exit markers with their timestamps and reasons.
Use the price overlay and adjacent timeframes to test whether momentum agrees with structure. Trade outcomes are retrospective evidence, not a trigger.
How to read this widget
Use these points to interpret the visible values before moving to a related record or decision.
Market Breadth compares the distribution of scanner states. Signal Timeline follows one symbol through time. MACD Profiles compares each enabled profile without creating a second, duplicated chart.
Use the zero baseline, acceleration marker, profile agreement, crossover recency, stability, and normalized strength together. A profile moving toward zero may be weakening before its direction changes.
Price overlay helps relate momentum to market movement. Event and divergence markers identify notable transitions, while tenant trade outcomes support visual review. Extra layers can be hidden when they obscure the profiles.
Field reference
Use these definitions to interpret the widget consistently across cryptocurrency and stock markets.
| Field | Meaning | Practical use |
|---|---|---|
| MACD profile | Fast period, slow period, and signal period used for one line. | Compare the same profile over time; different profiles have different sensitivity. |
| Histogram value | Distance between MACD and signal line for the profile. | Above zero indicates positive momentum; movement toward zero can show fading momentum. |
| Crossover marker | MACD crossing its signal line. | Treat recent crosses as events requiring price and trend confirmation. |
| Direction-change / divergence | A change in directional state or disagreement between price and momentum. | Use as an early warning and investigate the underlying candles. |
| Profile agreement / signal strength | How many profiles align and the normalized combined score. | Prefer stable multi-profile agreement over a single fast-profile spike. |
Short profiles react quickly to crypto volatility and produce more noise; confirm with volume, funding, and a higher timeframe.
Use slower profiles around session noise and earnings/news; confirm with price structure and volume because MACD is lagging.
My Coin Trends provides market information and technical signals. It is not investment advice. Verify every signal against current market structure, liquidity, and your own risk limits before making a trading decision.