Features Standard

Scanner Intelligence

Investigate market rotation, opportunity progression, multi-timeframe confluence, replay evidence, and measured trade outcomes in one connected workspace.

Availability

Standard

Use this widget with its linked state records, your selected timezone, and independent risk management. A signal or chart does not guarantee a trade outcome.

Step-by-step use

Scanner Intelligence

Investigate market rotation, opportunity progression, multi-timeframe confluence, replay evidence, and measured trade outcomes in one connected workspace.

  1. 1
    1. Choose the view

    Start with Rotation Map or Opportunity Funnel, select a period, and confirm the data age and last successful synchronization before interpreting a signal.

  2. 2
    2. Review the context

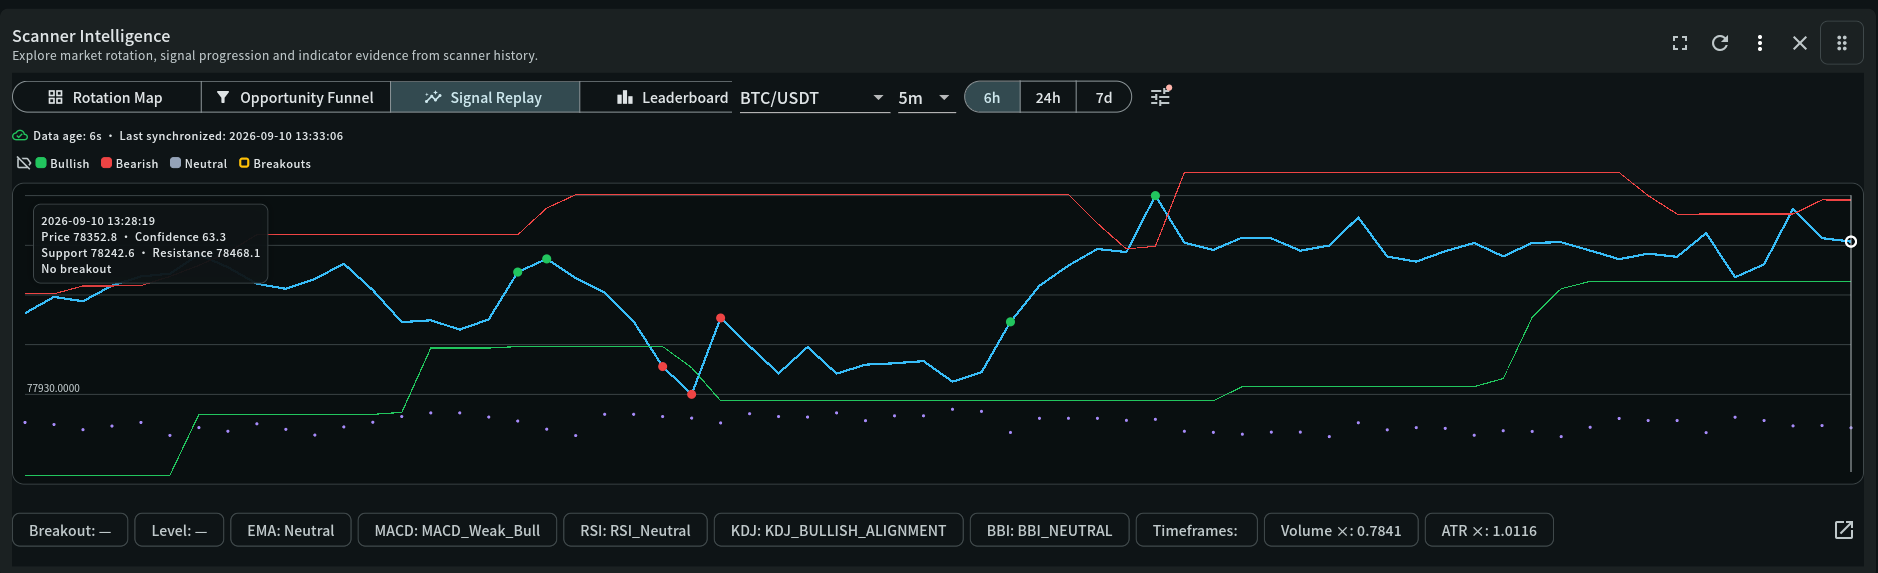
    Select a cell, stage, or ranked symbol to open Signal Replay; inspect price, support and resistance, breakout evidence, confidence, and EMA, MACD, RSI, KDJ, BBI, volume, and ATR context.

  3. 3
    3. Continue your review

    Compare adjacent timeframes, stability, failures, and outcome sample size before creating a controlled alert or continuing to an independently risk-managed decision.

Recommended attention order

What to review first

Use Rotation Map and Leaderboard to discover candidates, then follow this live confirmation sequence. Outcomes validates the process afterward; it does not replace current evidence.

Early Warning → Breakout Watch → Replay evidence → Multi-Timeframe Confluence → Confirmed Breakout

  1. Check freshness before starting

    Verify Data Age, Last Synchronized, and rollup progress. Stale or incomplete intelligence cannot support a time-sensitive decision.

  2. Early Warning

    Treat this as the earliest notice that participation or structure may be changing. It starts observation; it is not an entry instruction.

  3. Breakout Watch

    Check whether the developing condition approaches or tests a meaningful support, resistance, or breakout level with improving confidence and expansion.

  4. Replay evidence

    Use Signal Replay as the primary evidence view. Inspect price structure, level interaction, confidence, volume and ATR expansion, and EMA, MACD, RSI, KDJ, and BBI tags.

  5. Multi-Timeframe Confluence

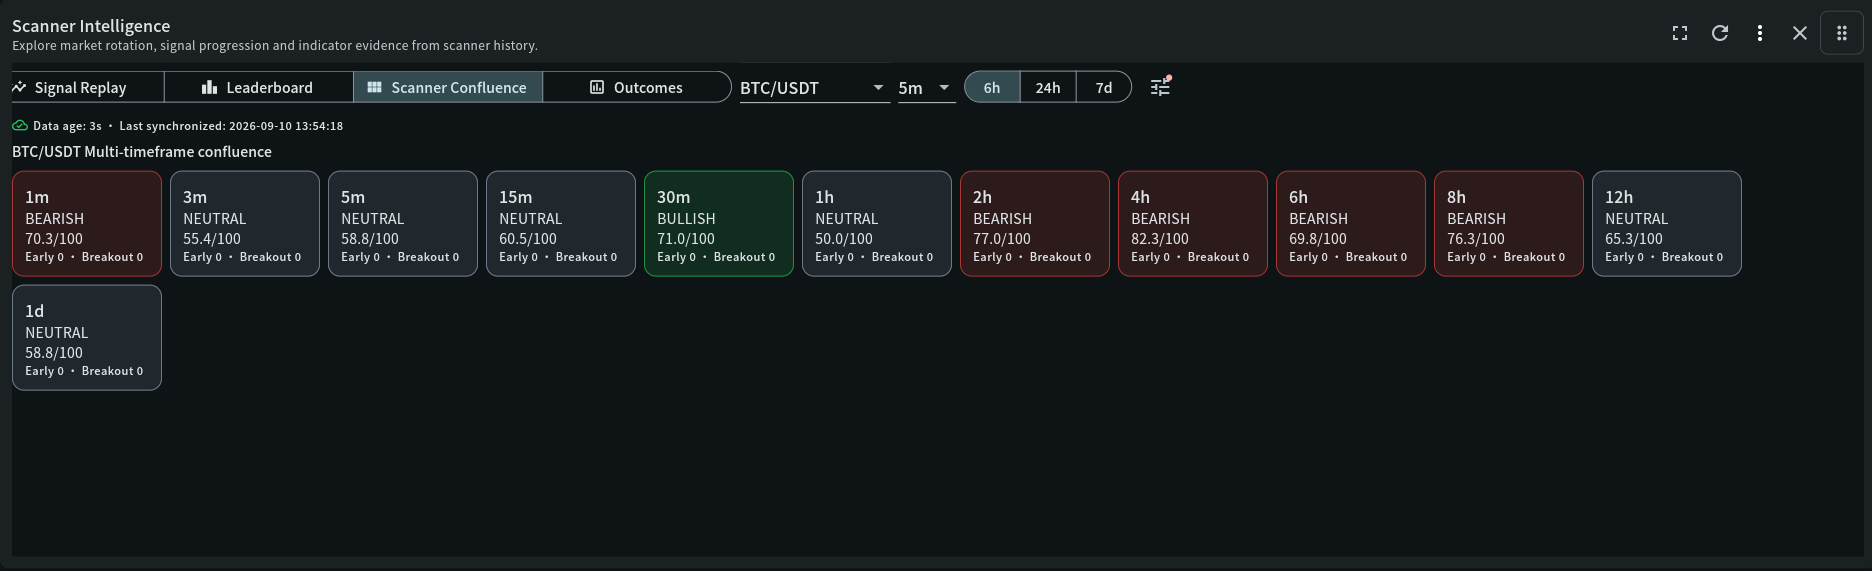
    Compare adjacent eligible timeframes. Agreement is normally more stable than an isolated fast signal; disagreement can identify a counter-trend move.

  6. Confirmed Breakout

    Only after reviewing Replay and Confluence, determine whether the developing condition has received confirmation. Confirmation is stronger but later and can still fail.

  7. Outcomes after the live review

    Use sample size, success rate, average return, MFE, and MAE to evaluate similar completed setups. Outcomes is historical validation, not a live trigger.

How to read this widget

Scanner Intelligence

Use these points to interpret the visible values before moving to a related record or decision.

Rotation Map

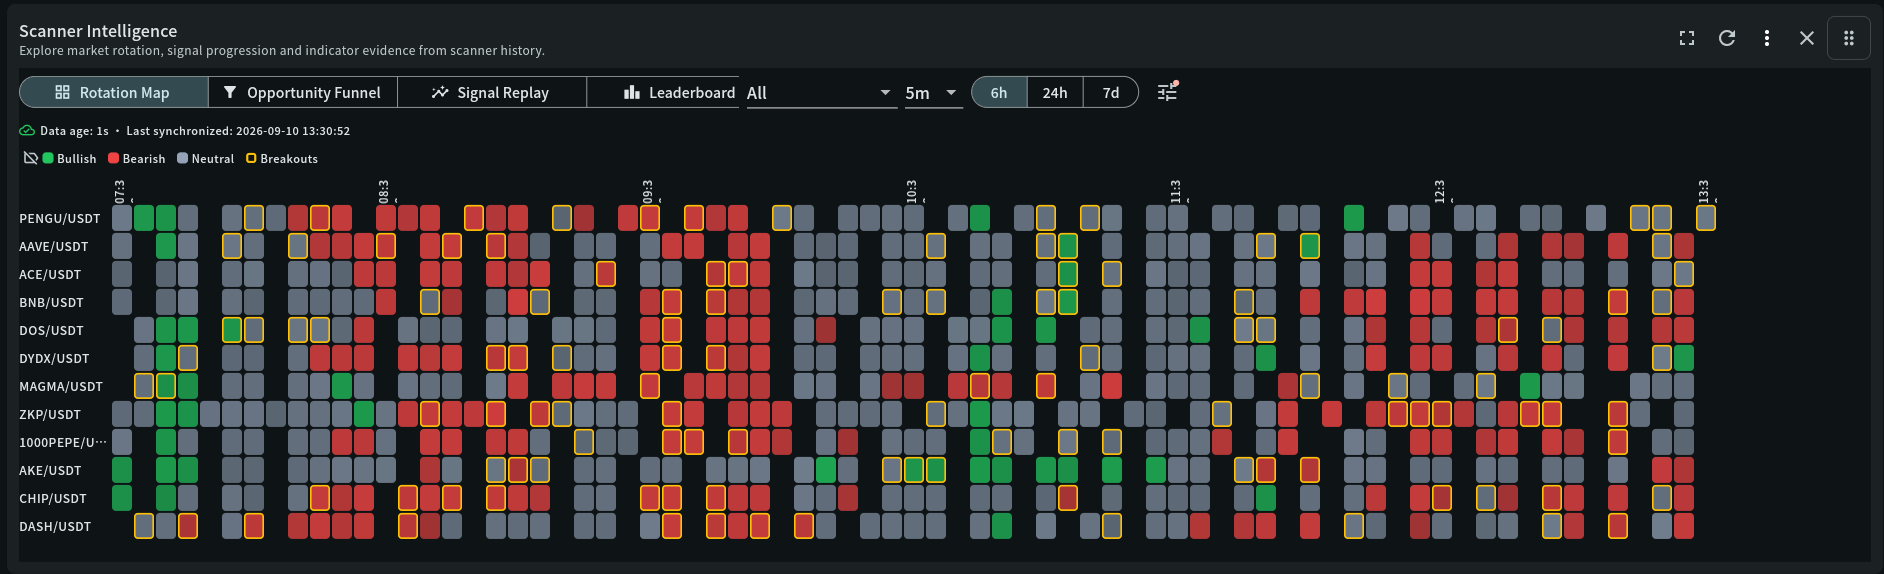
Rows represent symbols and cells represent time buckets. Green indicates bullish dominance, red bearish dominance, and grey neutral or mixed conditions. Stronger shading reflects confidence; an outlined cell contains event evidence. Choose All for a market view or one symbol to filter the map.

Opportunity Funnel

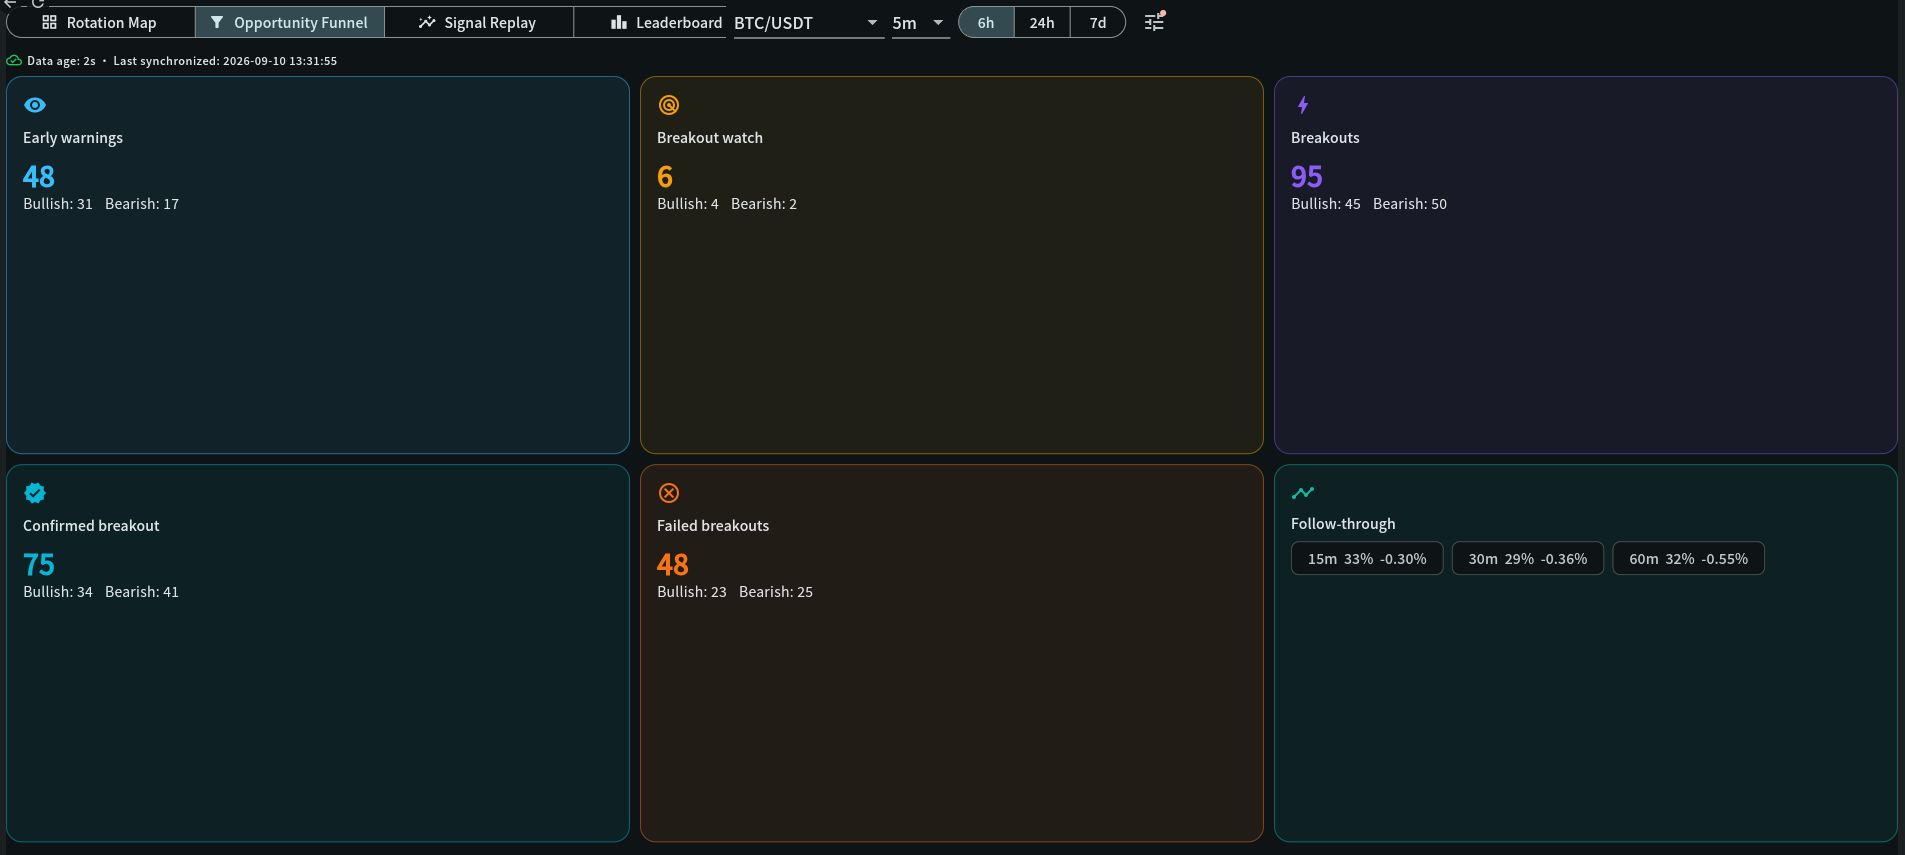
Follow progression from Early Warning through Breakout Watch, Breakout, Confirmed Breakout, or Failed Breakout. Select a stage to narrow the Leaderboard, and judge follow-through percentages together with their sample sizes.

Signal Replay and evidence

Use the crosshair or tap to inspect timestamp, price, support, resistance, direction, confidence, breakout level and reason. The evidence panel adds EMA, MACD, RSI, KDJ, BBI, volume expansion, ATR expansion, and contributing timeframes.

Multi-timeframe confluence

Compare eligible timeframes for one symbol. Agreement across adjacent intervals is normally more stable than an isolated fast-timeframe event; disagreement can identify a counter-trend move or developing transition.

Leaderboard and outcomes

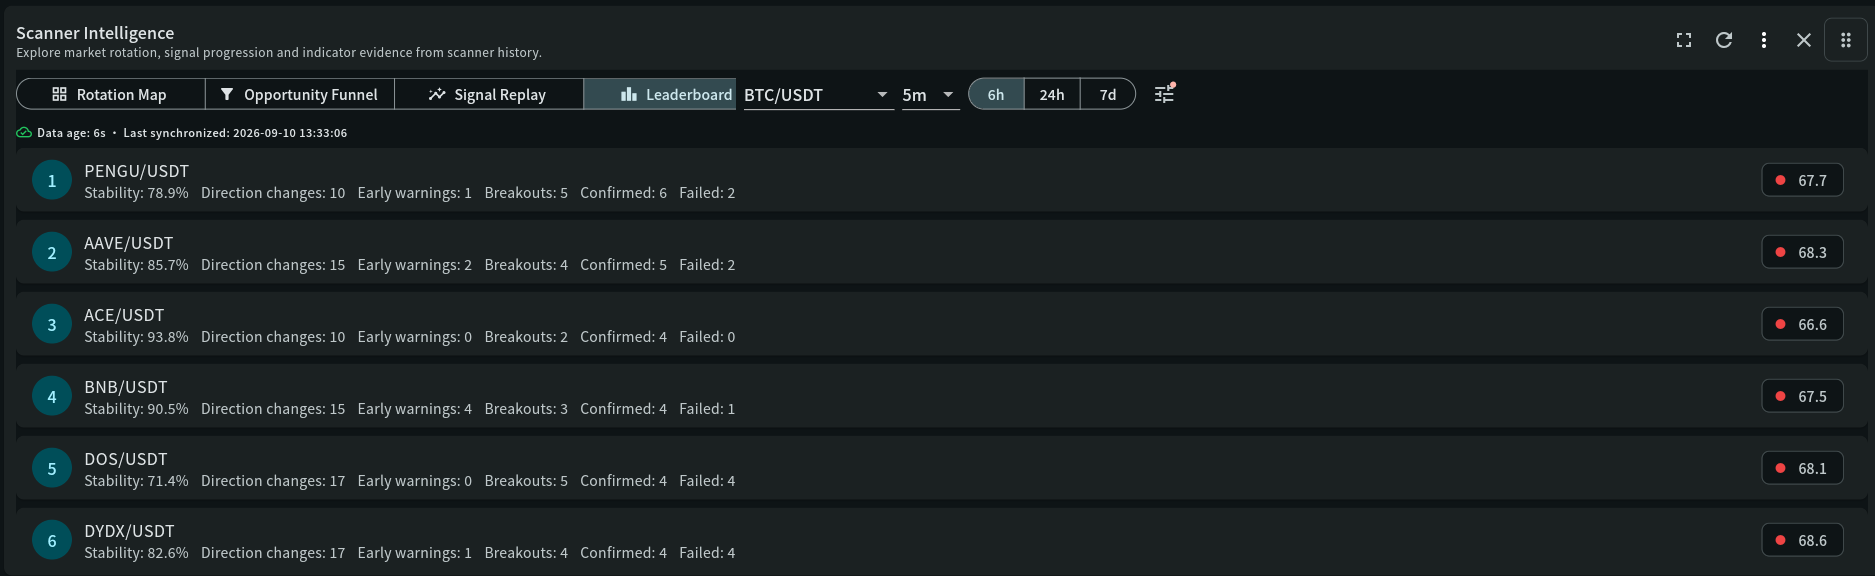
Rank symbols by opportunity, confidence, stability, and breakout activity. Where tenant trades exist, compare sample size, success rate, average return, maximum favourable excursion (MFE), and maximum adverse excursion (MAE)—not final P&L alone.

Alerts and freshness

Data age, synchronization status, and rollup progress determine whether the view is current. Alert rules support condition, direction, confidence, cooldown, and deduplication controls; they are monitoring aids rather than automatic trade instructions.

Field reference

What each value means

Use these definitions to interpret the widget consistently across cryptocurrency and stock markets.

FieldMeaningPractical use
Data age / last synchronizedHow old the newest observation is and when intelligence rollups last completed successfully.Resolve stale, incomplete, or failed synchronization before relying on time-sensitive evidence.
Rotation cellA symbol and time bucket coloured by dominant direction and confidence.Use it to locate changing participation, then select the cell for replay rather than trading from colour alone.
Funnel stageEarly Warning, Breakout Watch, Breakout, Confirmed Breakout, or Failed Breakout.Track opportunity progression and compare bullish/bearish totals with follow-through sample size.
Confidence / stabilityEvidence strength and persistence across recent observations.Rank candidates while penalising repeated direction changes and failed breakouts.
Support / resistance / breakout levelReference structure surrounding the selected replay observation.Check whether price actually holds or rejects the level and define independent invalidation risk.
EMA / MACD / RSI / KDJ / BBIMomentum and trend evidence attached to the selected event.Look for complementary evidence; conflicting tags indicate uncertainty rather than a broken calculation.
Volume / ATR expansionParticipation and volatility change around the event.A breakout with expansion is generally stronger evidence than a low-participation move, but can still fail.
Success / return / MFE / MAEHistorical follow-through and best/worst movement for matched tenant trades.Always read with sample size; use MFE and MAE to review timing and risk placement, not to promise future results.

Cryptocurrency markets

For crypto, begin with current-session rotation, verify liquidity and 24/7 market context, then compare fast and higher eligible timeframes before acting.

Stock markets

For stocks, account for exchange hours, opening gaps, earnings, halts, and regular-session volume when interpreting replay and follow-through.

Risk notice

My Coin Trends provides market information and technical signals. It is not investment advice. Verify every signal against current market structure, liquidity, and your own risk limits before making a trading decision.