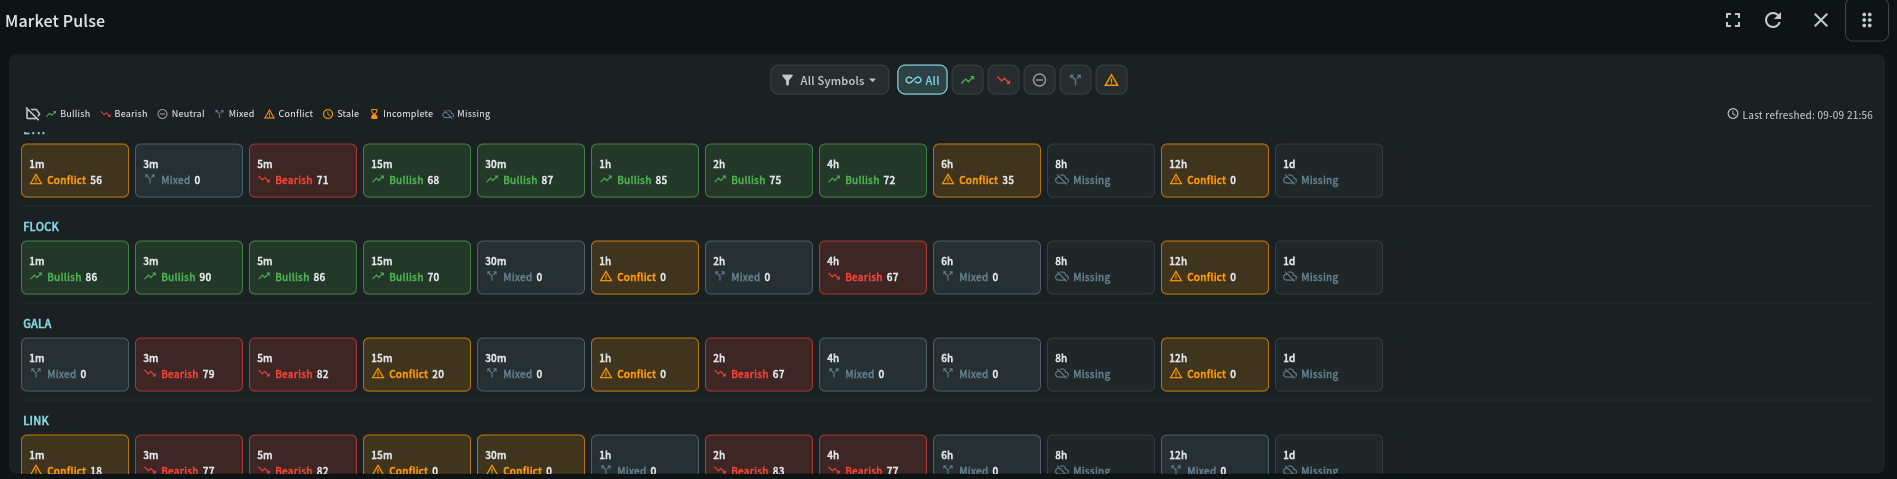
One tile is one symbol and timeframe
The tile score is the alignment score for that exact combination. Compare a symbol across timeframes instead of treating one short timeframe as the market-wide answer.
See group-aware Trend/MACD alignment for each symbol and timeframe with bullish, bearish, neutral, mixed, and conflict filters.
Availability
StandardUse this widget with its linked state records, your selected timezone, and independent risk management. A signal or chart does not guarantee a trade outcome.
Step-by-step use
See group-aware Trend/MACD alignment for each symbol and timeframe with bullish, bearish, neutral, mixed, and conflict filters.
Use the symbol and timeframe selectors.
Choose an alignment state filter.
Hover or tap a result for the underlying alignment explanation.
Recommended attention order
Market Pulse provides a broad alignment map. Use filters to find aligned or conflicting areas, then inspect the exact symbol/timeframe tile and its Trend/MACD explanation.
Scan all states → Filter alignment → Select symbol/timeframe → Inspect score and profiles → Confirm momentum and price
Start with All to understand whether the monitored market is broadly bullish, bearish, mixed, neutral, or conflicted.
Use Bullish, Bearish, Neutral, Mixed, or Conflict to isolate candidates without losing their timeframe identity.
One tile describes one symbol and timeframe. Never treat a short-interval tile as the direction of the entire market.
Read score, configured-profile count, trend direction, MACD direction, histogram context, and synchronization time in the tooltip.
Open MACD Signal Insights and Price Action Insights to verify persistence, crossover context, market structure, and risk.
How to read this widget
Use these points to interpret the visible values before moving to a related record or decision.
The tile score is the alignment score for that exact combination. Compare a symbol across timeframes instead of treating one short timeframe as the market-wide answer.
Green is bullish aligned and red bearish aligned. Neutral means no directional alignment; Mixed indicates incomplete or differing direction; Conflict indicates disagreement between sources or profiles.
Hover or tap a tile for the trend, MACD direction, configured-profile count, alignment state, and histogram context. Strong alignment still needs fresh source data and risk review.
Field reference
Use these definitions to interpret the widget consistently across cryptocurrency and stock markets.
| Field | Meaning | Practical use |
|---|---|---|
| Alignment state | Bullish, bearish, neutral, mixed, or conflict relationship between trend and MACD sources. | Use as a market map, then drill into the symbol and timeframe. |
| Score / profile count | Strength and number of agreeing configured profiles. | Higher agreement is more consistent, but does not remove event or liquidity risk. |
| Histogram context | Whether momentum is strengthening, weakening, or crossing zero. | A weakening reading can warn before a direction change. |
Use several timeframes because crypto trades 24/7 and local session liquidity changes throughout the day.
Anchor the pulse to the primary exchange session and treat pre-market/after-hours alignment separately.
My Coin Trends provides market information and technical signals. It is not investment advice. Verify every signal against current market structure, liquidity, and your own risk limits before making a trading decision.