Reading the candle
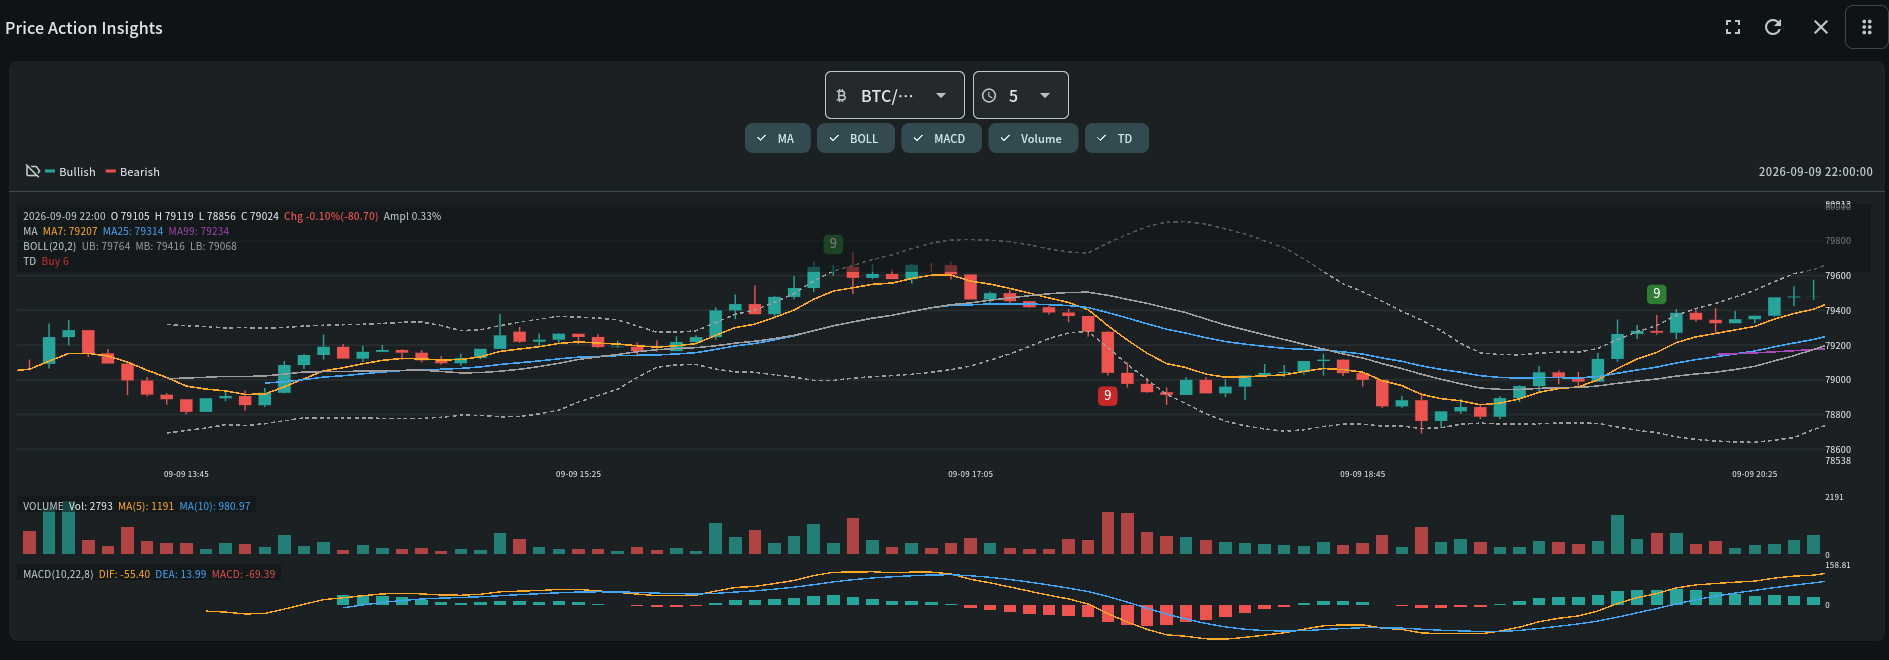
The body shows the open and close for that period; the wick above and below shows the high and low reached during it. Body colour shows whether the close was above or below the open.

Visualise price movement as candlesticks with moving average, Bollinger Bands, MACD, volume, and TD Sequential overlays.
Availability
StandardUse this widget with its linked state records, your selected timezone, and independent risk management. A signal or chart does not guarantee a trade outcome.
Step-by-step use
Visualise price movement as candlesticks with moving average, Bollinger Bands, MACD, volume, and TD Sequential overlays.
Open Price Action Insights and choose a symbol and timeframe.
Toggle MA, BOLL, MACD, Volume, and TD overlays as needed.
Scroll to zoom, and use the crosshair tooltip for exact values.
Recommended attention order
Price Action Insights is the final structure and execution review. Read candles first, then add trend, volatility, participation, momentum, and exhaustion overlays in that order.
Select symbol/timeframe → Read candles and levels → MA/Bollinger context → Volume and MACD confirmation → TD review and risk plan
Select the symbol and timeframe, load enough history, and use zoom or drag without changing the meaning of the underlying candles.
Identify trend, range, swing highs/lows, support, resistance, candle bodies, wicks, and gaps before enabling more indicators.
Use moving averages and Bollinger Bands to assess direction, compression, expansion, and relative position—not fixed reversal levels.
Compare volume and MACD with the price move. Breakouts without participation or with weakening momentum require caution.
Treat TD 9 or 13 as exhaustion/continuation context, never a standalone reversal order. Define invalidation, position size, and reward-to-risk independently.
How to read this widget
Use these points to interpret the visible values before moving to a related record or decision.
The body shows the open and close for that period; the wick above and below shows the high and low reached during it. Body colour shows whether the close was above or below the open.
Moving averages, Bollinger Bands, MACD, and TD Sequential counts are all calculated from the same candles and stay aligned to them when you zoom or pan.
Scroll to zoom in on a cluster of candles or out for broader context. Zooming changes what you can see, not the underlying data — confirm any reading against the current timeframe and symbol.
Field reference
Use these definitions to interpret the widget consistently across cryptocurrency and stock markets.
| Field | Meaning | Practical use |
|---|---|---|
| OHLC candle | Open, high, low, and close for one interval. | Read body and wick together to identify rejection, continuation, and range expansion. |
| MA / Bollinger Bands | Trend smoothing and volatility envelope. | Bands describe relative expansion, not fixed support or resistance. |
| Volume | Traded activity for the candle and moving-volume comparisons. | Confirm breakouts with participation; low-volume moves are easier to reverse. |
| TD Sequential | A counted exhaustion/continuation sequence. | A 9 or 13 is a setup for review, not a standalone reversal order. |
| MACD panel | Momentum and signal relationship below price. | Compare momentum direction with price structure and avoid relying on one indicator. |
Use exchange volume, ATR, and liquidation context; thin pairs can print misleading wicks.
Use split-adjusted prices, session volume, gap context, and earnings/news calendars; TD and moving averages do not account for fundamentals.
My Coin Trends provides market information and technical signals. It is not investment advice. Verify every signal against current market structure, liquidity, and your own risk limits before making a trading decision.