One row, one exact market state
Each candidate represents one symbol and one eligible timeframe. Standard users receive eligible states from the 15-minute timeframe onward.

Rank symbols where independent scanner, momentum, trend, participation, structure, and higher-timeframe evidence agree—and expose conflicts before a decision is made.
Availability
StandardUse this widget with its linked state records, your selected timezone, and independent risk management. A signal or chart does not guarantee a trade outcome.
Widget views
Compare the ranked confirmation summary with the selected candidate’s complete supporting and opposing evidence.
Step-by-step use
Rank symbols where independent scanner, momentum, trend, participation, structure, and higher-timeframe evidence agree—and expose conflicts before a decision is made.
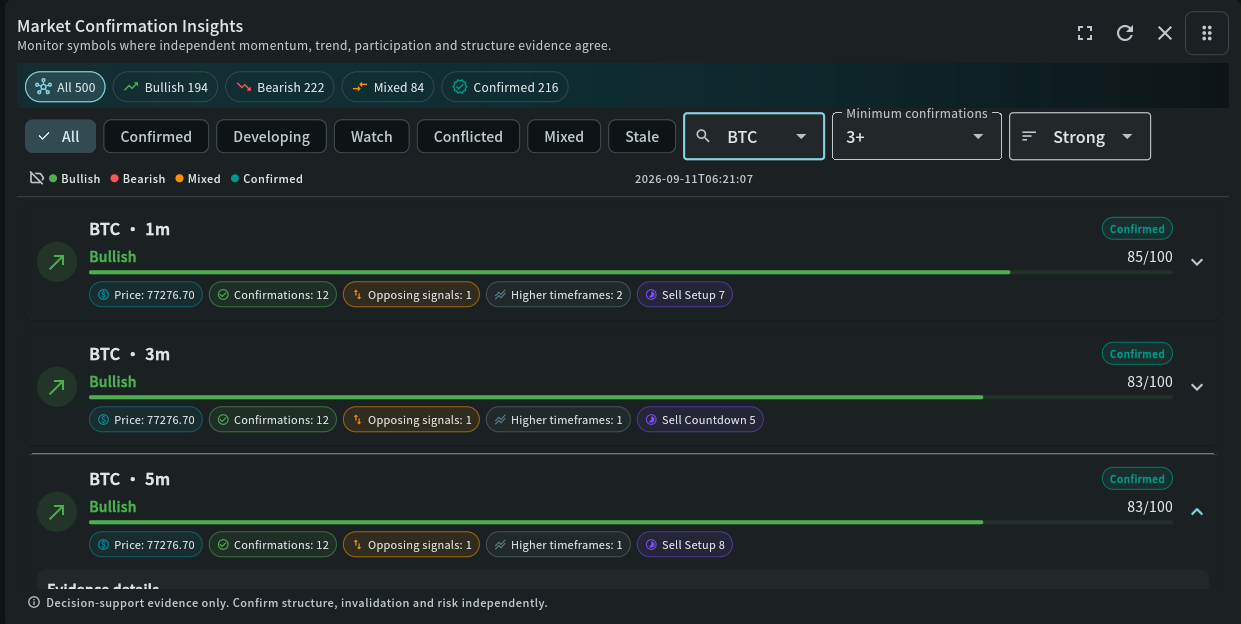
Start with All to understand the current distribution, then select Bullish, Bearish, Mixed, or Confirmed to narrow the candidates.
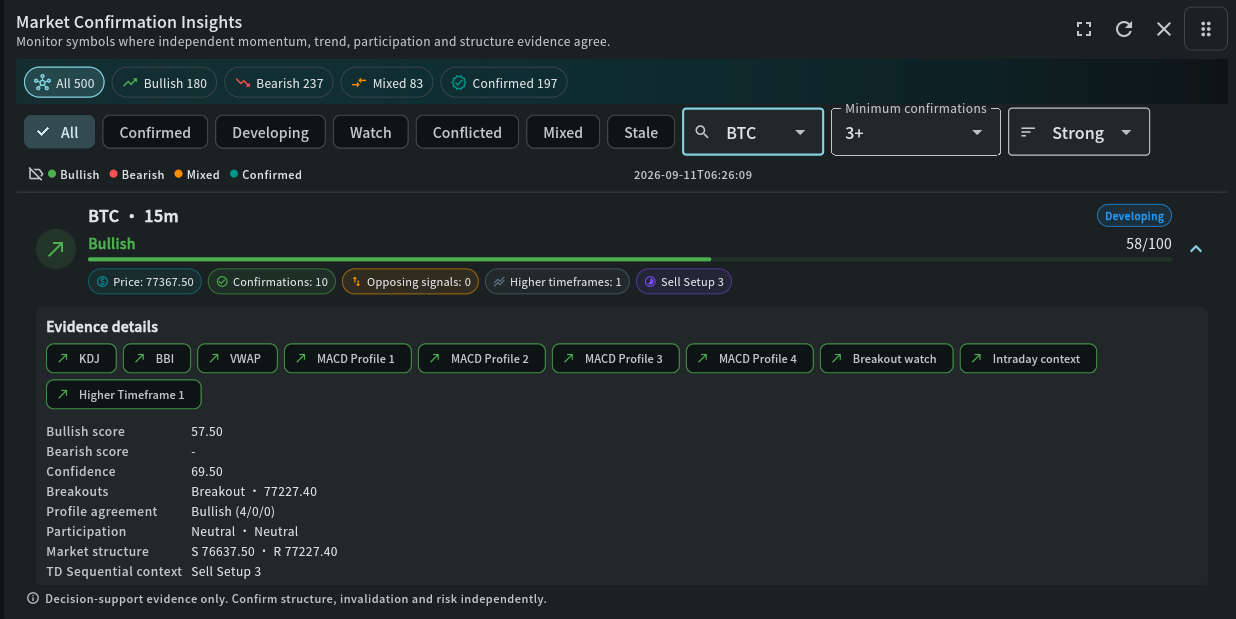
Set the minimum confirmation count and rank by strength, freshness, or symbol. Open a candidate to inspect every contributing and opposing source.
Validate support, resistance, Price/OI participation, higher-timeframe agreement, and TD risk context before continuing to My Chart.
Recommended attention order
Market Confirmation Insights combines independent evidence per coin and timeframe. Shortlist symbols in Summary, then open a symbol’s Candidates and the evidence behind a row.
Summary: Top Bullish / Top Bearish → symbol → Candidates: All / Bullish / Bearish / Mixed → Confirmed and Minimum confirmations → Sort leaderboard → Evidence details
Top Bullish and Top Bearish rank up to ten symbols (an Administrator can change this; ten by default) from fresh Confirmed, Developing and Watch readings at the current minimum confirmations, one row per symbol at its strongest timeframe. Confirmed rows come first, then the highest Confluence score. Timeframes lists every timeframe on that side; Opposing counts fresh timeframes pointing the other way. Each symbol is listed on its dominant side only (more timeframes, then more Confirmed ones; a full tie lists it on both).
Tap a ranked row to open that symbol on Candidates, filtered to the same side. A high rank is a shortlist, not a trade instruction.
Rows marked Stale are not current. Standard accounts see 15m and longer timeframes.
All, Bullish, Bearish or Mixed, the Confirmed status filter and Minimum confirmations (in Filter and sort; tap Apply).
Strongest or Newest. Clear filters returns to the full list.
Bullish score against Bearish score, Confirmations against Opposing signals, and Higher timeframes. Developing, Watch and Conflicted mark rows still forming or contested.
Breakouts, Profile agreement, Participation, Market structure, TD Sequential context and Risk context. Check the support comes from independent sources, not one signal repeated.
Open My Chart to set invalidation and reward-to-risk. TD 9 / 13 is context only and adds no directional vote.
How to read this widget
Use these points to interpret the visible values before moving to a related record or decision.
Each candidate represents one symbol and one eligible timeframe. Standard users receive eligible states from the 15-minute timeframe onward.
Confirmed has strong directional evidence plus a fresh higher-timeframe match. Developing has meaningful agreement that is not fully confirmed. Watch is an earlier, weaker condition. Conflicted means meaningful evidence exists on both sides. Stale means the source is too old for time-sensitive interpretation.
Bullish or Bearish identifies the dominant side. Confluence score measures the weighted strength of that side. Always compare the bullish score, bearish score, confirmation count, and opposing signals rather than relying on the headline alone.
The evidence drawer shows scanner direction, EMA, OBV, RSI, KDJ, BBI, VWAP, enabled MACD profiles, early warnings, breakouts, trend state, intraday state, Price/OI, and adjacent higher timeframes when each source is fresh and available.
Price, support, resistance, breakout level, volume expansion, ATR expansion, and Price/OI context help determine whether directional momentum is supported by an observable market move and participation.
TD setup and countdown values can highlight possible exhaustion or continuation context. They carry no directional vote in the confluence score and must never be treated as a standalone reversal order.
The widget refreshes automatically while the Dashboard is open and also supports manual refresh. Filters and sorting change the monitoring view; they do not alter the underlying evidence or trigger a trade.
Field reference
Use these definitions to interpret the widget consistently across cryptocurrency and stock markets.
| Field | Meaning | Practical use |
|---|---|---|
| Symbol / timeframe | The instrument and candle interval represented by one confirmation row. | Compare like-for-like intervals. Standard users receive eligible timeframes from 15m onward. |
| Direction / maturity status | The dominant bullish, bearish, or mixed bias and its Confirmed, Developing, Watch, Conflicted, or Stale maturity. | Use maturity to distinguish broad agreement from an early or contradictory observation. |
| Confluence score | A normalized summary of independent evidence after source weights, conflicts, and freshness are considered. | Rank candidates with it, but inspect the evidence rather than treating the score as a trade instruction. |
| Bullish / bearish / opposing confirmations | Counts of independent sources supporting each side and the evidence opposing the displayed direction. | Prefer broad agreement with limited opposition; a high raw count can still be conflicted. |
| Evidence sources / weights | The scanner, MACD, trend, Price/OI, structure, breakout, and higher-timeframe sources contributing to the row. | Expand the row and verify that confirmation comes from different evidence families, not repeated versions of one signal. |
| Price / support / resistance / breakout | Current price and the nearest structural levels or breakout state available to the summary. | Check whether price holds the relevant level and define invalidation before considering an entry. |
| Participation / expansion / higher timeframe | Price/OI participation, volume or ATR expansion, and agreement or conflict from adjacent higher intervals. | Use participation and higher-timeframe structure to test whether the move has support beyond the selected candle. |
| TD 9 / TD 13 context | Exhaustion or continuation counts reported as risk context without adding a directional confirmation vote. | Use TD to review timing and risk; never use a 9 or 13 as a standalone reversal order. |
| Freshness / refreshed at | How current the underlying observations and combined summary are. | Do not rely on a Stale row for time-sensitive decisions; refresh and investigate its source services first. |
For crypto, verify liquidity, continuous-session volatility, funding context, and agreement between the selected interval and a higher eligible timeframe.
For stocks, interpret confirmation within exchange hours and account for opening gaps, earnings, halts, and regular-session participation.
My Coin Trends provides market information and technical signals. It is not investment advice. Verify every signal against current market structure, liquidity, and your own risk limits before making a trading decision.