Read across each timeframe
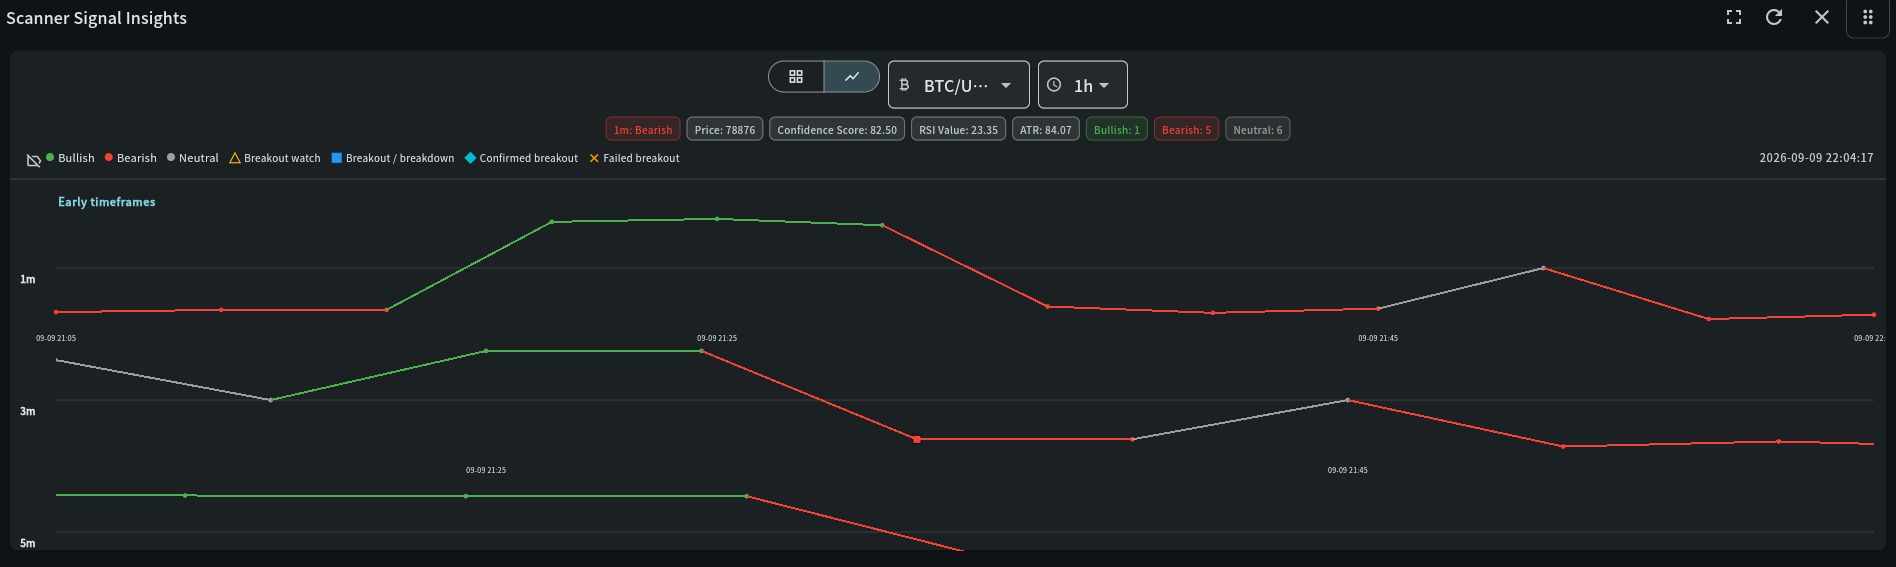
Each row is one timeframe and each block is an observation in time. Consecutive green or red blocks show persistence; alternating colours show unstable or changing conditions.
Read a concise event timeline of scanner trend changes, indicator tags, price, ATR, and RSI context.
Availability
StandardUse this widget with its linked state records, your selected timezone, and independent risk management. A signal or chart does not guarantee a trade outcome.
Step-by-step use
Read a concise event timeline of scanner trend changes, indicator tags, price, ATR, and RSI context.
Choose a symbol and timeframe.
Set the lookback window from 5 minutes up to 24 hours.
Review the ordered timeline instead of interpreting unrelated charts.
Recommended attention order
Use Scanner Signal Insights to test persistence within and across timeframe lanes. A sequence of observations is more informative than one coloured point.
Select symbol/window → Read lane persistence → Inspect change marker → Open tooltip evidence → Compare higher timeframes
Choose the instrument, eligible timeframe, and window, then check the latest timestamp before reading the lanes.
Consecutive bullish or bearish observations show persistence; alternating states indicate noise, transition, or weak stability.
Use early-warning, breakout, confirmed, failed, and direction-change markers to identify where deeper review is warranted.
Read timestamp, price, trend, confidence, RSI, ATR, EMA, MACD, VWAP, KDJ, and BBI information instead of inferring values from colour.
Compare the selected lane with adjacent higher timeframes and open Scanner Intelligence Replay when event-level evidence is needed.
How to read this widget
Use these points to interpret the visible values before moving to a related record or decision.
Each row is one timeframe and each block is an observation in time. Consecutive green or red blocks show persistence; alternating colours show unstable or changing conditions.
Hover or tap a block to read its exact timestamp, trend, confidence score, price, RSI, ATR, and technical tags. Do not infer those values from colour alone.
A single block is a snapshot. Give more weight to agreement across the chosen timeframe and repeated observations within the lookback window.
Field reference
Use these definitions to interpret the widget consistently across cryptocurrency and stock markets.
| Field | Meaning | Practical use |
|---|---|---|
| Trend | Directional state for each timeframe lane. | Look for persistence and cross-timeframe agreement. |
| Confidence score | Strength of the scanner evidence at that observation. | Compare like-for-like timeframes and watch for sudden score deterioration. |
| RSI / ATR | Momentum position and current volatility estimate. | Avoid chasing an extended RSI move and size risk using ATR context. |
| EMA / MACD / VWAP tags | Compact labels describing indicator relationships. | Read the exact tooltip and confirm the candle timestamp before acting. |
VWAP and volume are especially useful for intraday crypto execution; ATR helps normalize risk across volatile pairs.
Use session VWAP and regular-session volume; adjust ATR for gaps and avoid treating overnight prints as equivalent liquidity.
My Coin Trends provides market information and technical signals. It is not investment advice. Verify every signal against current market structure, liquidity, and your own risk limits before making a trading decision.