Market Confirmation
Why One Indicator Is Never Enough: A Real Example of 12 Timeframes Disagreeing
Using a real Multi-Timeframe Confluence grid for one symbol, this article shows exactly how differently the same market can read depending on which single timeframe you happened to check — and why My Coin Trends is built around agreement, not any one signal.
By admin · Updated 12 September 2026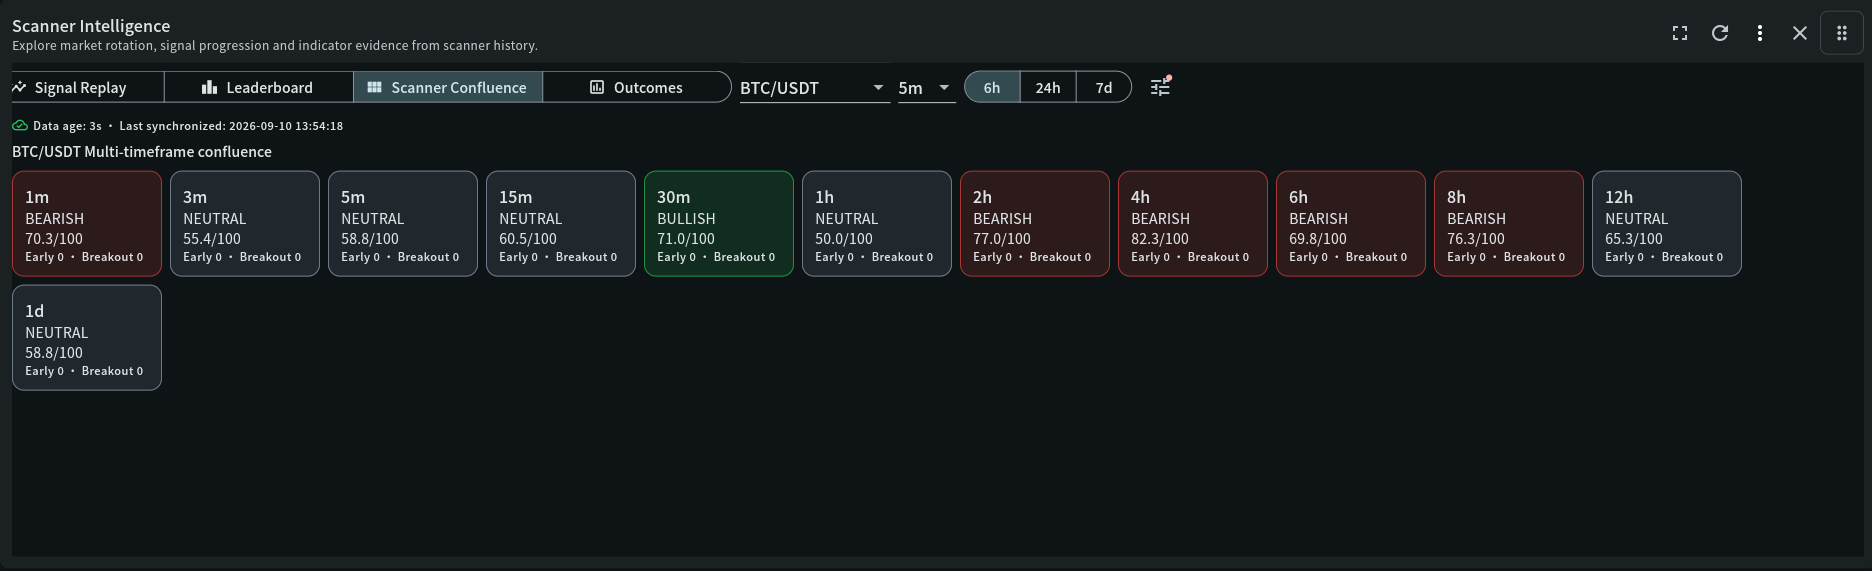
Screenshot, decoded
Reading this panel
This is a real confluence grid for one symbol (BTC/USDT). Every tile below reflects the exact same symbol at the exact same moment — only the timeframe changes.
Twelve tiles, one symbol
1m through 1d, each an independent read for the same BTC/USDT at the same instant. The product actually tracks even more timeframes than shown here (out to 1 week) — this grid is already a partial view.
Direction and score per tile
Each tile shows a direction (Bearish/Neutral/Bullish) and a score out of 100. That score is itself an average across multiple recent observations for that timeframe, not a single candle's reading — already one layer of aggregation before you even compare timeframes to each other.
The disagreement, read straight from the numbers
1m Bearish 70.3, 3m/5m/15m Neutral, 30m Bullish 71.0, 1h Neutral, 2h Bearish 77.0, 4h Bearish 82.3, 6h Bearish 69.8, 8h Bearish 76.3, 12h/1d Neutral. One timeframe — 30 minutes — is confidently bullish while four others are confidently bearish, on the same symbol, at the same time.
"Early" and "Breakout" counts per tile
Each tile also reports how many early-warning and breakout events that timeframe has logged recently. All zero here — a reminder that a directional score can exist even without any breakout activity backing it up yet.
Freshness row
"Data age: 3s · Last synchronized..." applies to the whole grid — confirm this before treating any of the disagreement above as current.
Key terms
Indicator definitions
What each term means in My Coin Trends, and why it matters when you're reading the widget.
| Term | Definition | Why it matters |
|---|---|---|
| Confluence | Agreement among multiple independent sources — timeframes, indicator families, or evidence types — pointing the same direction at the same time. | The entire reason My Coin Trends' confirmation tools exist: a single strong-looking signal is common; broad, independent agreement is rare and worth far more. |
| Single-timeframe bias | The tendency to treat whichever timeframe you happen to be looking at as representative of the whole market. | The exact mistake this screenshot demonstrates concretely — the 30-minute chart alone would have given a confidently wrong overall picture. |
| Aggregated score | A score averaged across multiple recent observations, rather than read from a single candle. | Even one tile's score is already smoothed evidence, not a raw single-point reading — and it can still disagree sharply with its neighbors, which is the real lesson here. |
Worked example
Walking through it
Following the exact numbers from the screenshot above through to a conclusion — not a hypothetical.
- Check only the 30-minute chart
Bullish, 71.0/100 — on its own, a fairly confident bullish read.
- Check only the 4-hour chart
Bearish, 82.3/100 — an even more confident read, in the opposite direction, for the exact same symbol at the exact same time.
- Look at all twelve together
The honest picture: one clearly bullish timeframe, several clearly bearish ones (2h, 4h, 6h, 8h), and the rest neutral. Neither single chart from steps 1 or 2 told the truth on its own.
- What this actually supports
Given this spread, the defensible read is "mixed, leaning bearish on the slower timeframes" — not a confident call in either direction, and certainly not the clean bullish story the 30-minute chart alone would have suggested.
Whenever a single chart, indicator, or timeframe gives you a confident answer, ask what a different timeframe on the same symbol would say right now. This example shows the answer can be the complete opposite — which is the entire case for confirmation-based tools over any single signal.
Read this before you rely on it
Limitations and conflicting evidence
Confluence reduces, but does not eliminate, the risk of a misleading read — all twelve timeframes can occasionally agree and still be wrong together, especially around genuine news events that invalidate recent history all at once. A tile's score is itself an average of recent observations, so a fast-moving change in real conditions can take a little time to show up, particularly on the slower timeframes. Use disagreement across timeframes as a reason for caution and further investigation, not as a puzzle to be resolved by picking whichever timeframe agrees with what you already believed.
Go deeper
Related widget documentation
Scanner Intelligence
Investigate market rotation, opportunity progression, multi-timeframe confluence, replay evidence, and measured trade outcomes in one connected workspace.
Open documentation →Market Confirmation Insights
Rank symbols where independent scanner, momentum, trend, participation, structure, and higher-timeframe evidence agree—and expose conflicts before a decision is made.
Open documentation →Risk notice
My Coin Trends provides market information and technical signals. It is not investment advice. Verify every signal against current market structure, liquidity, and your own risk limits before making a trading decision.This article is educational content describing how My Coin Trends' indicators work; it is not a recommendation to buy, sell, or hold any asset.