
Risk Management
Building Your Own Invalidation Plan From What the Panel Actually Shows You
My Coin Trends surfaces support, resistance, confidence, and confirmation evidence — but never a stop-loss. This article walks through turning a real Signal Replay reading into your own independent invalidation and risk plan.
By admin · Updated 15 September 2026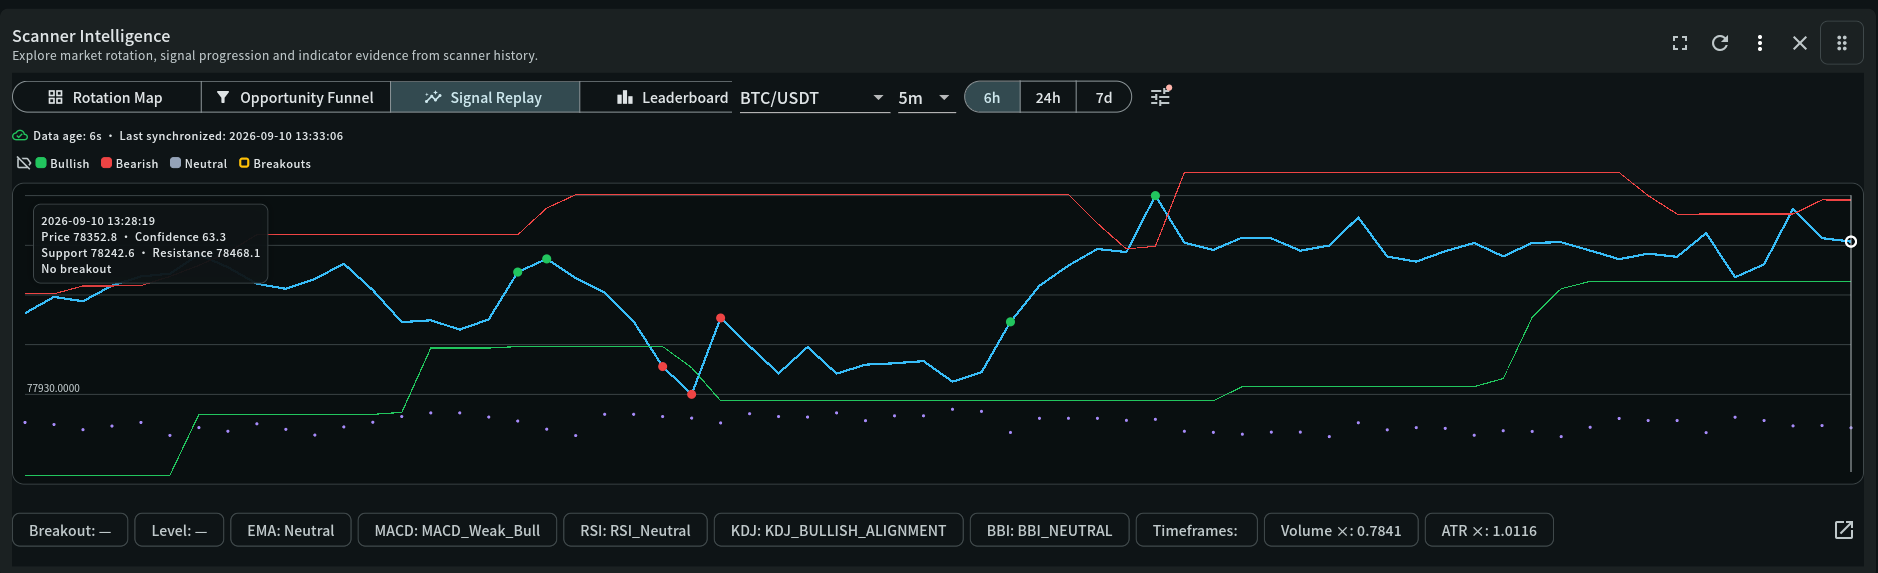
Screenshot, decoded
Reading this panel
The same Signal Replay reading used elsewhere in this Learning Centre, read here specifically for what it gives you to build a risk plan around.
Support and resistance as invalidation candidates
"Support 78242.6 · Resistance 78468.1" are real, current structural levels — natural, objective candidates for where a bullish or bearish idea would be proven wrong, rather than an arbitrary percentage or round number.
Confidence as a sizing input, not a certainty
"Confidence 63.3" describes the strength of the evidence behind this exact reading — useful for scaling how much weight (and how much size) you give an idea, never a promise of the outcome.
Breakout state as a timing check
"No breakout" here means price has not actually cleared a level yet — a reminder to separate "a level worth watching" from "a level that has already been tested," since your plan for each is different.
The evidence bar as your pre-decision checklist
EMA, MACD, RSI, KDJ, BBI, Volume ×, and ATR × are exactly the independent checks this Learning Centre's other articles walk through in depth — used together here as a checklist to run through before finalizing a plan, not after.
What is deliberately absent
There is no stop-loss field, no position-size suggestion, and no "risk this much" instruction anywhere on this panel — that gap is intentional, and it is the part of the plan only you can fill in.
Key terms
Indicator definitions
What each term means in My Coin Trends, and why it matters when you're reading the widget.
| Term | Definition | Why it matters |
|---|---|---|
| Invalidation level | The specific price or condition that, if reached, means the original idea was wrong — decided in advance, before entering. | The single most important number in any plan, precisely because it has to be decided before you have an emotional stake in being right. |
| Position sizing | How much of your account you commit to one idea, typically set so that hitting your invalidation level costs a small, predetermined fraction of your account. | This depends entirely on your own account size and risk tolerance — nothing in My Coin Trends' evidence panels can or should decide this for you. |
| Decision-support evidence | Information that helps you make an informed decision without making the decision for you. | Every panel across this product — confidence scores, confluence status, breakout state — is built to this standard deliberately; treating any of it as an instruction rather than an input is a misuse of the tool. |
Worked example
Walking through it
One way to turn the exact screenshot above into a plan — illustrative, not a recommendation to act on these specific numbers.
- Define the idea
Price at 78352.8 sitting between support (78242.6) and resistance (78468.1), with mixed evidence and no active breakout — the idea, if any, would be watching for a confirmed break of one of these two levels.
- Set the invalidation level before anything else
For a bullish idea built around a break of resistance, a close back below support would be a reasonable, objective invalidation — decided now, not renegotiated later if price gets close to it.
- Size the position to the distance to invalidation
The further price would have to travel to reach the invalidation level, the smaller the position needs to be to risk the same fixed fraction of the account — this is arithmetic you do, not something the panel calculates.
- Decide what would upgrade or kill the idea before it happens
Using this Learning Centre's other articles: a Confirmed (not just raw) breakout would upgrade the idea; a Failed breakout, a bearish flip in the multi-timeframe confluence, or price closing through the invalidation level would kill it — write these down before you need them.
A risk plan built this way does not depend on the outcome to know whether it was a good decision — it was defined by what evidence would prove the idea right or wrong before either happened. My Coin Trends can hand you the evidence; only you can decide the plan.
Read this before you rely on it
Limitations and conflicting evidence
None of this is financial advice, and nothing here is a specific stop-loss or position-size recommendation — the exact numbers in the worked example are illustrative only. A support or resistance level can shift as new candles form, so a plan built around a specific level should be revisited if the underlying level itself changes materially before your invalidation is reached. Risk management is an ongoing discipline, not a one-time calculation; the same process shown here is worth repeating for every idea, not just the first one you build.
Go deeper
Related widget documentation
Scanner Intelligence
Investigate market rotation, opportunity progression, multi-timeframe confluence, replay evidence, and measured trade outcomes in one connected workspace.
Open documentation →Price Action Insights
Visualise price movement as candlesticks with moving average, Bollinger Bands, MACD, volume, and TD Sequential overlays.
Open documentation →Risk notice
My Coin Trends provides market information and technical signals. It is not investment advice. Verify every signal against current market structure, liquidity, and your own risk limits before making a trading decision.This article is educational content describing how My Coin Trends' indicators work; it is not a recommendation to buy, sell, or hold any asset.