Market Structure
Crypto vs. Stock-Market Timeframes: How Session Structure Changes the Reading
Use the multi-timeframe grid correctly across continuously traded cryptocurrency and session-based stocks, including gaps, closed-market periods, and data freshness.
By admin · Updated 11 September 2026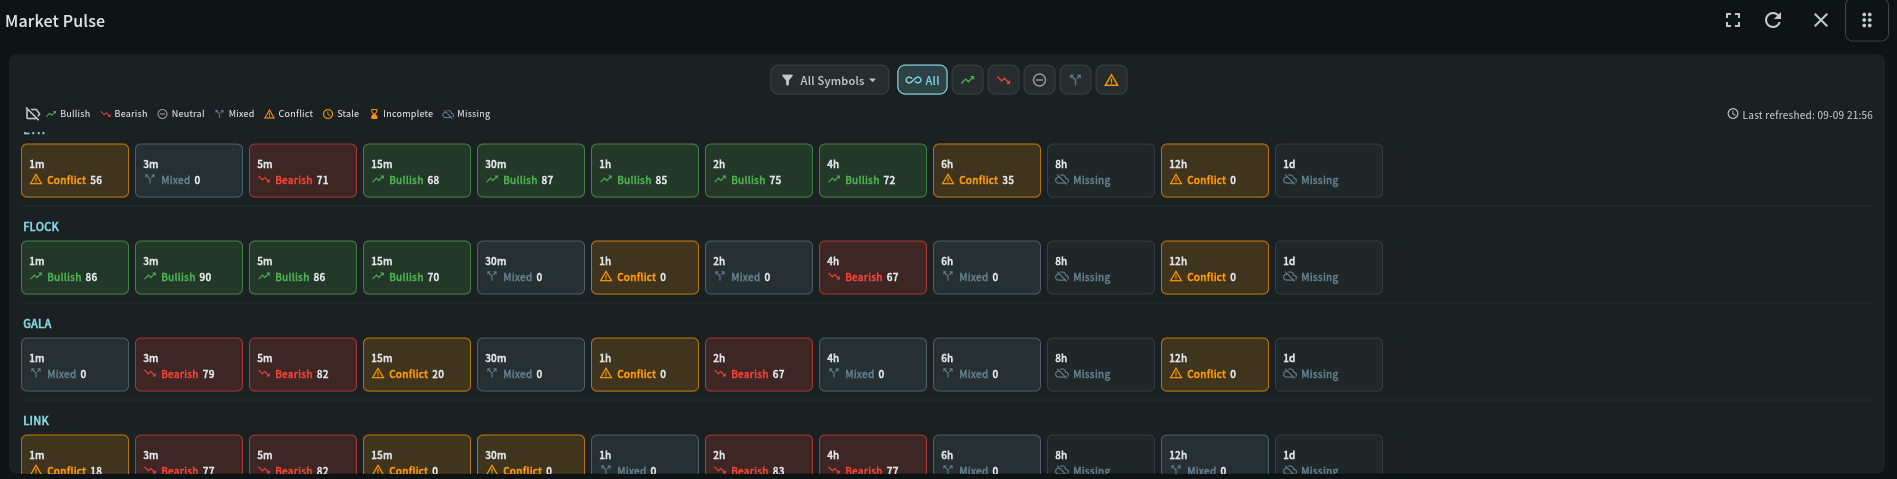
Screenshot, decoded
Reading this panel
This Market Pulse grid shows how one instrument can produce different readings across timeframes. The interpretation depends on whether that instrument trades continuously or within an exchange session.
Timeframe columns
The grid can compare intervals from fast intraday candles through daily and higher-timeframe context, subject to role eligibility and available source data. For cryptocurrency these intervals run continuously; for stocks they are formed from the trading data supplied for the relevant exchange session.
Symbol rows
Each row is one symbol across the available timeframes. Read cryptocurrency and stock rows separately: the faster columns describe immediate movement, while slower columns retain broader context and may include prior stock-market sessions.
Access filter
"All Symbols" and the direction filter icons narrow which rows are shown; they do not change what any individual cell reports.
Missing cells
A cell marked "Missing" means no usable observation exists for that symbol and timeframe. The cause can be initial collection, unavailable source data, or a closed stock-market session; it carries no bullish, bearish, or neutral meaning.
Last refreshed
Shown top-right — check this the same way you would check Data Age elsewhere: it tells you how current this entire grid is before you read any individual cell.
Key terms
Indicator definitions
What each term means in My Coin Trends, and why it matters when you're reading the widget.
| Term | Definition | Why it matters |
|---|---|---|
| Continuous trading | Crypto markets trade 24 hours a day, 7 days a week, with no scheduled close. | Candle boundaries continue through nights and weekends, although liquidity and volatility can still vary by region and hour. |
| Session-based trading | Stocks trade during exchange-defined sessions and may also have distinct pre-market or after-hours data. | Opening gaps, closing auctions, earnings, halts, and quiet out-of-session periods can materially change volume, volatility, and freshness. |
| Timeframe eligibility | Which candle intervals an account can view — public Standard access begins at 15 minutes; faster 1-, 3-, and 5-minute intervals are reserved for authorized internal administrator roles. | Two accounts can legitimately see different pictures of the same symbol at the same moment simply because of which timeframes they are each eligible to view. |
| Session-aware logic | Interpretation that considers whether a stock observation is in-session, after-hours, delayed, or separated from the prior candle by a market closure. | The dashboard supplies technical evidence, but the user must still verify exchange hours, corporate events, halts, and the current tradable quote. |
Worked example
Walking through it
Apply the same dashboard consistently while respecting the different market clocks.
- A crypto 1-hour candle at 3am is just another candle
There is no scheduled exchange close before it, but regional liquidity can still be thinner. Confirm participation rather than assuming every hour has equal quality.
- A stock's 1-hour candle at the open is not just another candle
It may follow a real gap from the prior close and often carries unusually high volume and volatility. Check the exchange session and current quote before comparing it with an ordinary midday candle.
- Use the same evidence, but change the validation
For either market, compare direction, structure, participation, and higher timeframes. For stocks, add exchange hours, gaps, earnings, news, and halts to the checklist before drawing a conclusion.
Timeframe agreement is most useful when the observations are fresh and interpreted in the correct market context. Agreement across stale stock cells or thin cryptocurrency hours is weaker than current, well-participated evidence.
Read this before you rely on it
Limitations and conflicting evidence
Technical indicators cannot explain every opening gap, earnings surprise, halt, corporate action, exchange rule, liquidity change, or delayed market-data condition. Availability also varies by symbol, timeframe, role, and data provider. Confirm a stock against its exchange session and a current tradable quote; confirm cryptocurrency against a reliable venue and current liquidity. The dashboard supports research in both markets but does not remove these independent checks.
Go deeper
Related widget documentation
Market Pulse
See group-aware Trend/MACD alignment for each symbol and timeframe with bullish, bearish, neutral, mixed, and conflict filters.
Open documentation →Scanner Intelligence
Investigate market rotation, opportunity progression, multi-timeframe confluence, replay evidence, and measured trade outcomes in one connected workspace.
Open documentation →Risk notice
My Coin Trends provides market information and technical signals. It is not investment advice. Verify every signal against current market structure, liquidity, and your own risk limits before making a trading decision.This article is educational content describing how My Coin Trends' indicators work; it is not a recommendation to buy, sell, or hold any asset.