
Risk Context
TD Sequential 9 vs. 13: Reading the Setup and Countdown Counts Without Guessing a Reversal
A real Price Action Insights chart, annotated: what the TD Buy/Sell Setup count building toward 9 means, what the Countdown toward 13 adds on top, and why My Coin Trends treats both as risk context rather than a trade signal.
By admin · Updated 07 September 2026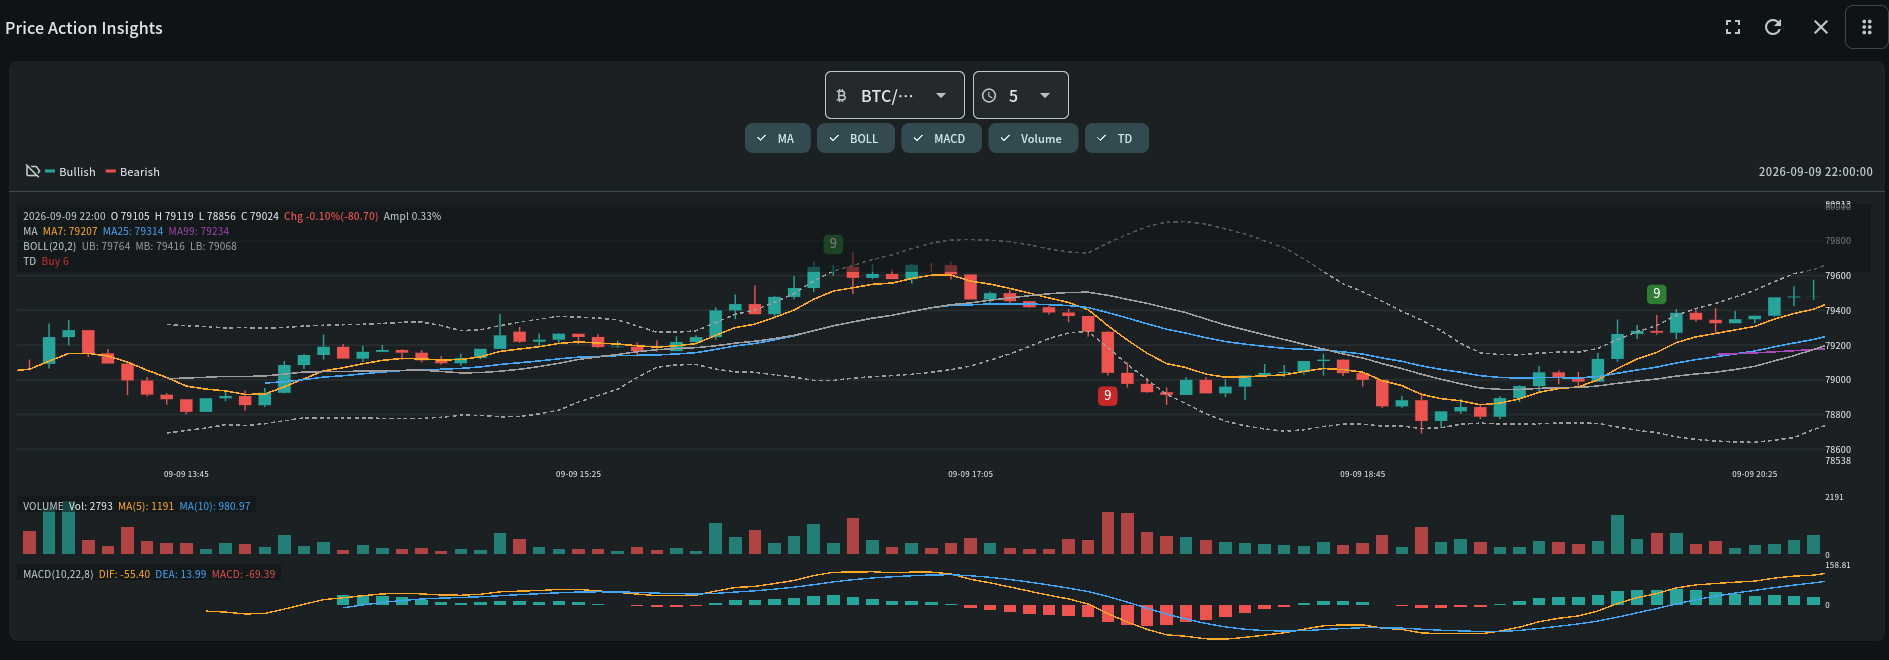
Screenshot, decoded
Reading this panel
This is a real Price Action Insights chart with every overlay switched on. Here is what the TD-related elements specifically show, in the order you would naturally read them.
TD toggle and readout line
"TD Buy 6" in the top-left readout is the live, in-progress count for the current bar — here, 6 of the 9 bars needed for a Buy Setup have printed so far. This number updates every candle and resets to zero the moment a close breaks the pattern.
Numbered badges on the chart
The green and red circles marked "9" further back on the chart are completed Setup counts from earlier in the session — a green 9 for a completed Buy Setup, a red 9 for a completed Sell Setup. These are historical: once a count completes or resets, its badge stays on the chart as a record, it does not keep updating.
MA readout
MA7 / MA25 / MA99 — three moving averages of different speeds plotted for general trend context alongside the TD count. TD Sequential does not use these directly; they are a separate overlay toggled on at the same time.
BOLL readout
Bollinger Bands (20-period, 2 standard deviations): upper, middle, and lower band. A TD count completing near the upper or lower band is a more commonly watched combination than one completing mid-band, though the count itself is calculated independently of the bands.
Volume and MACD panels below
The same chart shows Volume and MACD(10,22,8) underneath — useful to cross-check whether a completing TD count is happening on expanding or fading volume and momentum, rather than reading the count in isolation.
Key terms
Indicator definitions
What each term means in My Coin Trends, and why it matters when you're reading the widget.
| Term | Definition | Why it matters |
|---|---|---|
| TD Setup (the 9-count) | A count of up to 9 consecutive closes each compared to the close four bars earlier — lower for a Buy Setup, higher for a Sell Setup — with a "perfection" check on the final two bars. | The base building block: an in-progress count (like "Buy 6") is only a developing pattern, not yet a completed signal. |
| TD Countdown (the 13-count) | A separate count that can begin once a 9-count Setup completes, using a stricter bar-by-bar comparison and running up to 13. | A completed 13-count represents a more extended, more closely-watched exhaustion condition than a 9-count alone — but it takes materially longer to develop. |
| Perfection rule | A structural check on bars 8 and 9 of a Setup (their highs/lows must relate correctly to bars 6 and 7) that confirms the count reflects genuine price structure rather than a coincidental run of closes. | An unperfected 9-count is weaker evidence than a perfected one, even though both display as a completed count. |
Worked example
Walking through it
Using the exact readout in the screenshot above — "TD Buy 6" — as the starting point.
- Count stands at 6 of 9
Six consecutive bars have each closed lower than the close four bars before it. Three more consecutive qualifying closes would complete the Setup.
- Any non-qualifying close resets it
If the very next bar closes higher than its comparison bar instead of lower, the count breaks and returns to zero — it does not pause and resume.
- If it reaches 9, check perfection
A completed count still needs bars 8 and 9 to satisfy the perfection rule before it is treated as fully qualified — an unperfected count is noted but weighted as weaker.
- A completed 9 can start a Countdown toward 13
This is a separate, slower-developing count layered on top — reaching 13 takes meaningfully longer and is treated as a deeper exhaustion signal than a 9-count alone.
A TD count is a measure of how stretched a directional run has become, building in real time — it tells you to pay closer attention to reversal risk, not that a reversal is now due.
Read this before you rely on it
Limitations and conflicting evidence
TD Sequential counts are risk context only in My Coin Trends — they never add or subtract from any directional confluence score, and a completed 9 or 13 is not, on its own, a signal to enter a countertrend trade. A count can complete and price can simply continue in the same direction; treat every completion as a prompt to tighten risk management, not as a reversal instruction. Because the count resets on any non-qualifying close, a genuinely choppy market can produce several partial, reset counts in a row without ever completing — that is normal, not a malfunction.
Go deeper
Related widget documentation
Price Action Insights
Visualise price movement as candlesticks with moving average, Bollinger Bands, MACD, volume, and TD Sequential overlays.
Open documentation →Market Confirmation Insights
Rank symbols where independent scanner, momentum, trend, participation, structure, and higher-timeframe evidence agree—and expose conflicts before a decision is made.
Open documentation →Risk notice
My Coin Trends provides market information and technical signals. It is not investment advice. Verify every signal against current market structure, liquidity, and your own risk limits before making a trading decision.This article is educational content describing how My Coin Trends' indicators work; it is not a recommendation to buy, sell, or hold any asset.