
Scanner Intelligence
From Early Warning to Confirmed Breakout: A Field Guide to the Opportunity Funnel
A stage-by-stage walkthrough of the Opportunity Funnel — what each card, count, and follow-through number in the screenshot actually measures, and the exact evidence a raw breakout needs to reach Confirmed.
By admin · Updated 08 September 2026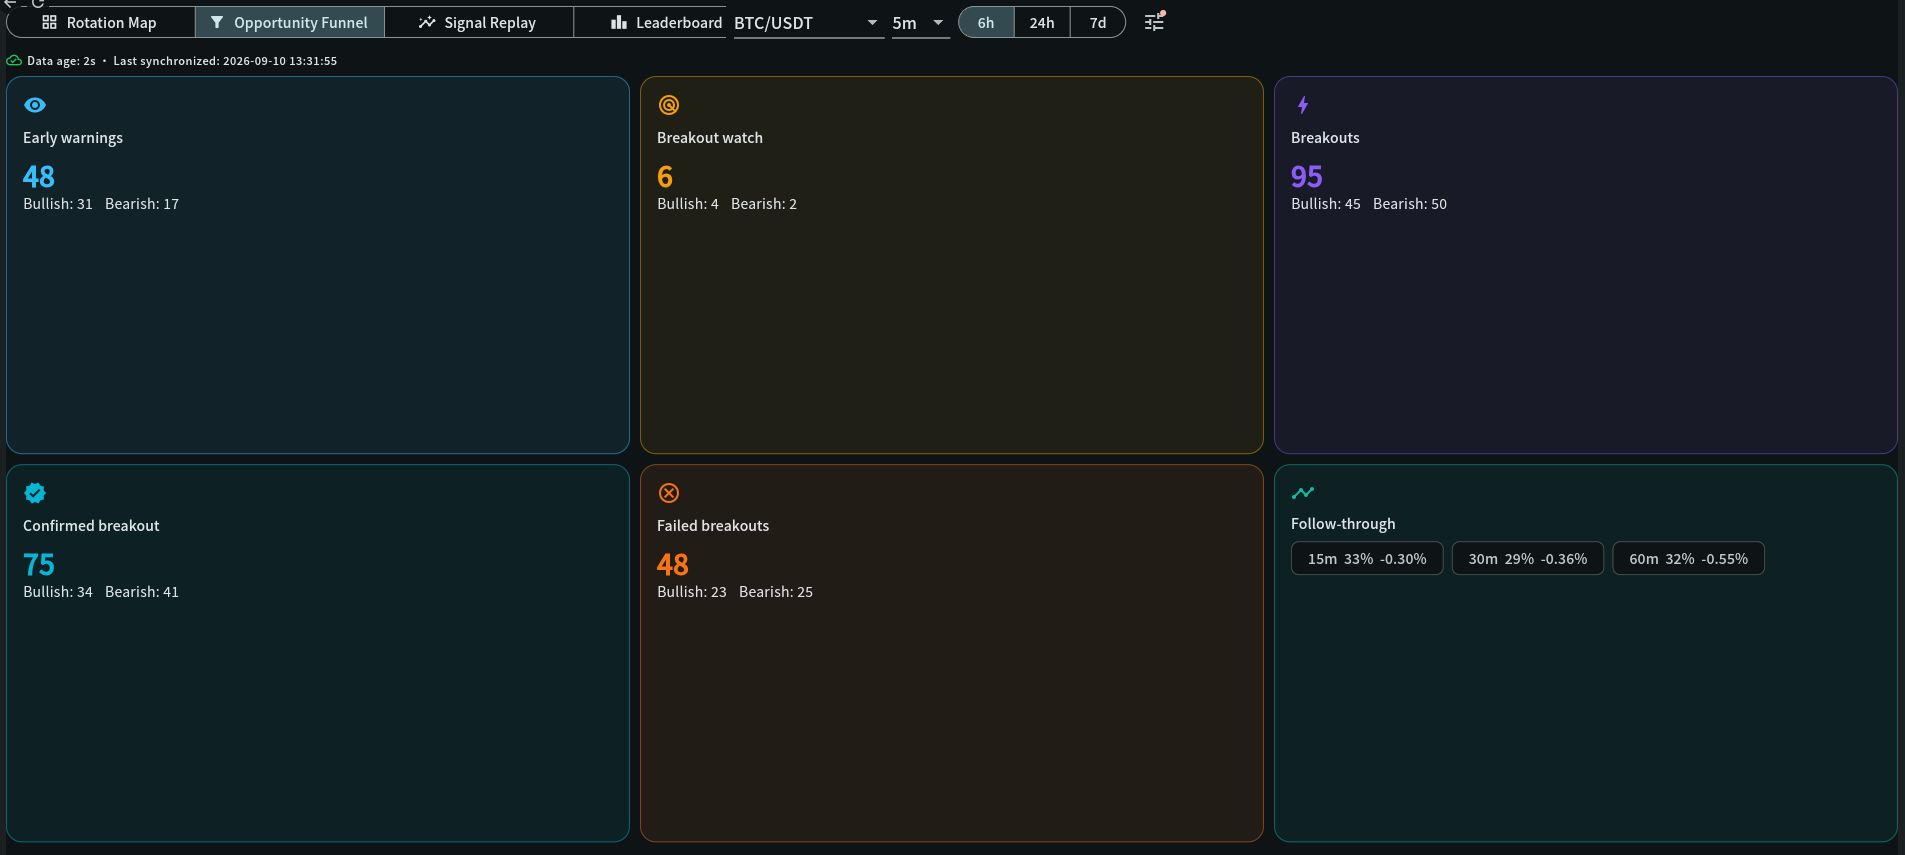
Screenshot, decoded
Reading this panel
This screenshot is a real Opportunity Funnel view for BTC/USDT at the 5-minute timeframe, 6-hour lookback. Here is what every element on it means.
View tabs — Rotation Map, Opportunity Funnel, Signal Replay, Leaderboard (plus Scanner Confluence and Outcomes further along the tab bar)
Scanner Intelligence is one connected workspace with six views of the same underlying data. Opportunity Funnel (selected here) groups signals by stage of maturity; the others show a market-wide heatmap, a single symbol's price replay, a ranked list, a multi-timeframe confluence grid, and historical trade outcomes — switching between them is a different lens on the same evidence, not a different data set.
Symbol, timeframe, and period controls
BTC/USDT at the 5-minute candle interval, with 6h selected (24h and 7d are also available). Every count on the six cards below describes only this exact symbol, timeframe, and lookback window — widen the period or change symbol and every number changes with it.
Freshness row — Data age and Last synchronized
Check this before trusting anything else on the page. A small data age (2 seconds here) with a recent synchronization timestamp means the six cards reflect the live market. A stale or growing data age means the counts below may not reflect what is happening right now — treat them as historical until it recovers.
Filter icon
Opens direction, event-type, and confidence filters for this view. The small red dot indicates a filter is currently active, worth checking if a count looks lower than you expect.
Early warnings card
The earliest, softest stage: momentum evidence suggests directional pressure may be building, before price has tested any real level. 48 total here, split 31 bullish / 17 bearish. This is a "start watching" list, not a shortlist of trade candidates.
Breakout watch card
Price is now approaching a real support/resistance/breakout level, and the existing early-warning direction still agrees. Only 6 here (4 bullish, 2 bearish) — a much smaller, more selective group than Early Warnings, because it additionally requires a real level to be nearby.
Breakouts card
Price has actually closed beyond a level by more than a small noise buffer. 95 total (45 bullish, 50 bearish) — structurally real, but on its own still a single-timeframe, single-signal event with no further confirmation required yet.
Confirmed breakout card
The strongest stage: a breakout that additionally has a high confidence score, agreement from other timeframes, real volume or volatility expansion, and aligned trend/momentum indicators. 75 here (34 bullish, 41 bearish) — close to, but not the same set as, the raw Breakouts count, because not every breakout goes on to confirm.
Failed breakouts card
Breakouts that later closed back inside the level they had broken, invalidating the move. 48 here (23 bullish, 25 bearish). This card is exactly why a raw "Breakout" alone is never enough evidence to act on — a meaningful share of breakouts end up here instead of at Confirmed.
Follow-through card
For this symbol's confirmed breakouts, the direction-adjusted rate that price kept moving favorably after 15, 30, and 60 minutes, alongside the average return at each horizon. Read both numbers together: a 33% follow-through rate at 15 minutes paired with a −0.30% average return means the losses among the 67% that did not follow through outweighed the gains among the 33% that did — a reminder that a hit rate alone never tells you whether the average outcome was actually profitable.
Why the card totals do not add up to one another
These six cards are independent counts over the lookback window, not one strict pipeline that narrows from top to bottom. A symbol can appear in more than one card if it reached different stages at different points in the period, so do not expect Confirmed plus Failed to sum neatly to Breakouts.
Key terms
Indicator definitions
What each term means in My Coin Trends, and why it matters when you're reading the widget.
| Term | Definition | Why it matters |
|---|---|---|
| Early Warning | Momentum evidence suggests directional pressure is building, ahead of any level test. | The earliest, weakest stage. Useful to start watching a symbol; not evidence for a decision on its own. |
| Breakout Watch | Price has moved within a defined proximity of a real support or resistance level, and the existing early-warning direction agrees. | Tells you a real structural test is close, but the level has not actually been broken yet. |
| Breakout / Failed | Price has closed beyond the level by more than a small buffer (to filter noise). If price later closes back inside the level, the breakout is reclassified as Failed. | Real structural evidence, but on its own it is not enough for the highest-confidence Confirmed state — many raw breakouts do not go on to confirm. |
| Confirmed Breakout | A breakout that additionally has a high confidence score, agreement from multiple other timeframes, real volume or volatility expansion, and aligned trend/momentum indicators. | The strongest, most evidenced state Scanner Intelligence produces — but "stronger" does not mean "certain." Confirmed breakouts can still reverse. |
Worked example
Walking through it
Illustrative progression through the five stages for one hypothetical symbol, not a live signal.
- Early Warning appears
Momentum evidence flags building directional pressure. Price is still well away from any meaningful level. This is a note to start watching, nothing more.
- Breakout Watch
Price approaches a resistance level identified from recent price structure. The early-warning direction still agrees. Worth attention, but the level has not been tested yet.
- Breakout
Price closes above the resistance level by more than the noise buffer. Structurally, this is real — but on its own it is a single-timeframe, single-signal event.
- Confirmation check
Before this breakout can be labeled Confirmed, it needs: a high combined confidence score, other timeframes independently agreeing on direction, a real expansion in volume or volatility (not just a quiet drift beyond the level), and trend/momentum indicators pointing the same way. If any of these is missing, the breakout stays at the weaker "Breakout" stage.
- Confirmed Breakout — or Failed
If every condition lines up, the signal is promoted to Confirmed Breakout, the strongest state the scanner produces. If instead price closes back inside the level before confirming, it is reclassified as Failed, regardless of how promising the early stages looked.
More confirmation means more independent evidence agrees — it does not mean the outcome is guaranteed. Use the stage to decide how much scrutiny a setup deserves, not as a replacement for your own invalidation and risk plan.
Read this before you rely on it
Limitations and conflicting evidence
These stages describe the strength of available evidence at one point in time, not a prediction. A Confirmed Breakout can still fail once real trading continues — confirmation happens later than an early warning, which is exactly why it needs more evidence in the first place. The underlying thresholds are tuned defaults, not universal truths, and can be too strict for quiet markets or too loose for very volatile ones. Follow-through percentages and average returns are only as reliable as their sample size — 6 observations in Breakout Watch is a far thinner sample than 95 in Breakouts, so weight a headline percentage accordingly. Never treat any single stage, including Confirmed, as an automatic instruction to enter or exit a position.
Go deeper
Related widget documentation
Scanner Intelligence
Investigate market rotation, opportunity progression, multi-timeframe confluence, replay evidence, and measured trade outcomes in one connected workspace.
Open documentation →Market Confirmation Insights
Rank symbols where independent scanner, momentum, trend, participation, structure, and higher-timeframe evidence agree—and expose conflicts before a decision is made.
Open documentation →Risk notice
My Coin Trends provides market information and technical signals. It is not investment advice. Verify every signal against current market structure, liquidity, and your own risk limits before making a trading decision.This article is educational content describing how My Coin Trends' indicators work; it is not a recommendation to buy, sell, or hold any asset.