Reading the candle
The body shows the open and close for that period; the wick above and below shows the high and low reached during it. Body colour shows whether the close was above or below the open.

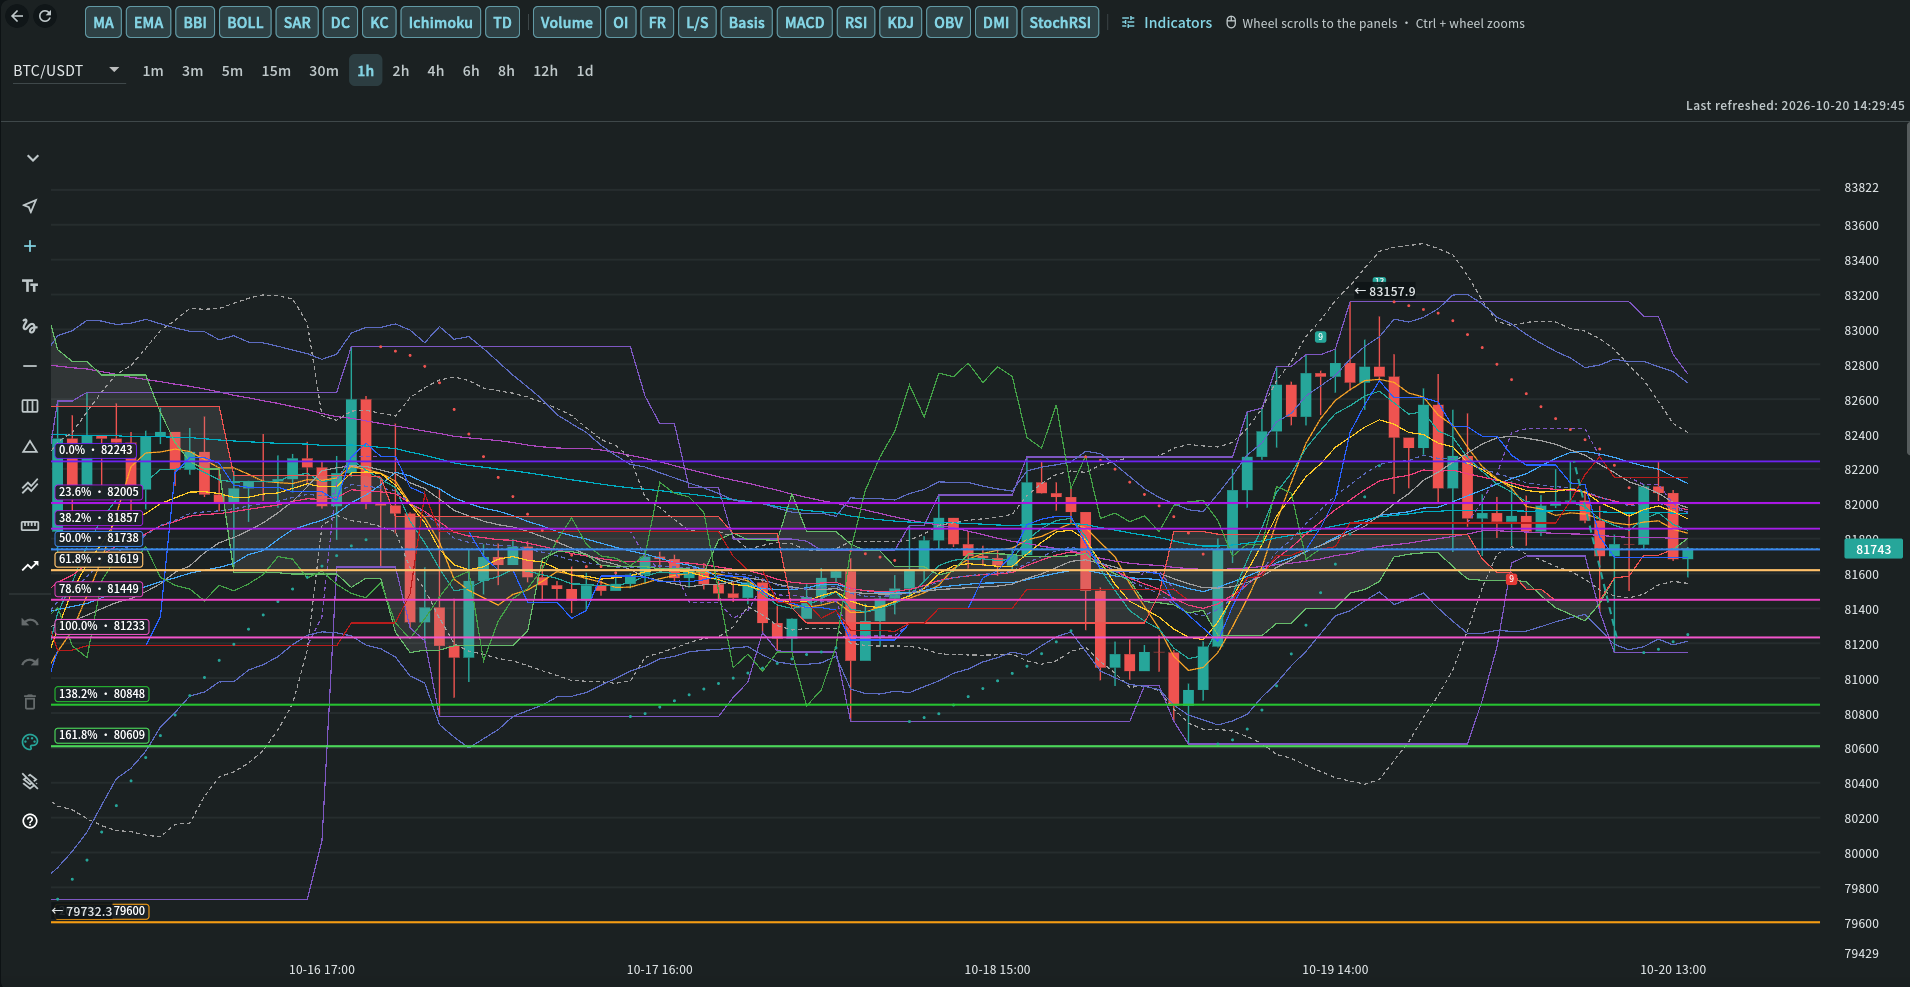
A candlestick chart with overlays (MA, EMA, BBI, BOLL, SAR, DC, KC, Ichimoku, TD) and aligned panels for volume, momentum (MACD, RSI, KDJ, OBV, DMI, StochRSI, AO, BRAR), derivatives (OI, FR, L/S, Basis) and order flow (Taker Flow, Large Trades, Trade Count, Liquidations), plus drawing tools.
Availability
StandardUse this widget with its linked state records, your selected timezone, and independent risk management. A signal or chart does not guarantee a trade outcome.
Step-by-step use
A candlestick chart with overlays (MA, EMA, BBI, BOLL, SAR, DC, KC, Ichimoku, TD) and aligned panels for volume, momentum (MACD, RSI, KDJ, OBV, DMI, StochRSI, AO, BRAR), derivatives (OI, FR, L/S, Basis) and order flow (Taker Flow, Large Trades, Trade Count, Liquidations), plus drawing tools.
Open My Chart and choose a symbol and timeframe.
Turn indicators and panels on with the shortcut boxes above the chart, or pin your own from Indicators.
Scroll or pinch to zoom; move over any panel for its value and time at the pointer.
Recommended attention order
My Chart is the candle chart. Read raw price first, then add indicators one at a time with the shortcut boxes above the chart (highlighted when on). Indicators lists every indicator: turn any on or off there and pin up to 20 as shortcuts; your shortcuts follow your account to every device. The chart icon next to a coin in Market Pulse, Market Confirmation Insights, Strategic Opportunity Insights, Price / OI Insights, Scanner Intelligence and Recent Alerts opens My Chart on that coin and timeframe.
Symbol / timeframe → candles → MA / EMA / BBI / BOLL / SAR / DC / KC / Ichimoku → Volume / MACD / RSI / KDJ / OBV / DMI / StochRSI / AO / BRAR → OI / FR / L/S / Basis → Taker Flow / Large Trades / Trade Count / Liquidations → Forecast → TD and risk plan
Pick the coin from the dropdown and tap a timeframe button beside it, from 1m to 1d. The newest candle updates live every few seconds while it forms, straight from Binance, so its indicators move until it closes. On mobile, pinch with two fingers to zoom in or out; use one finger to drag through history. Price and indicator panels stay aligned. Zoom can show roughly six candles at the closest view. Drag to the oldest loaded edge to request earlier candles; pinching does not request history.
Trend, range, swing highs and lows, support, resistance, bodies, wicks and gaps before any indicator.
MA uses simple averages and EMA uses exponential averages for 7, 25 and 99 closes. BBI averages the 3/6/12/24 simple averages and needs 24 closes. BOLL shows volatility compression and expansion. Read the colored values at the crosshair or latest visible candle.
Large Trades follows the symbol selected in My Chart and reads that symbol directly from Binance on your device. Selecting 1m, 5m or 15m opens the live WebSocket first, loads that recent REST history up to the current moment, merges overlapping trades, and then continues live without a hand-off gap. It highlights trades above the rolling 95th-percentile size: green is an aggressive buy and red is an aggressive sell. Up to five recently viewed symbols are retained temporarily in memory; collection is not saved. Compare participation and momentum with price. KDJ(9,3,3) shows K, D and J with 20/80 reference lines; J may exceed 0–100. OBV adds volume on rising closes and subtracts it on falling closes, starting at zero at the first loaded candle. Loading older history can shift its absolute level; compare its direction with price. Panels share horizontal navigation and the crosshair. Drag the six-dot handle beside any active panel name to move it up or down; the order is remembered for you. They are drawn below the price chart, which keeps its full size; scroll down to see them. With panels shown, the mouse wheel scrolls; hold Ctrl (Cmd on macOS) and turn the wheel to zoom. Move the mouse over, or touch, any panel to see its value and time at the pointer. After the first load one older page loads quietly, so every panel has values from the first visible candle.
The RSI chip opens RSI(6,12,24), as on AiCoin: three Wilder-smoothed lines from the loaded candle closes, fast (6), medium (12) and slow (24). Its scale is 0–100, with reference lines at 30 and 70: 30 or below is oversold, 70 or above is overbought; the status shown follows RSI(12). The fast line crossing the slower ones marks a momentum shift. The readout follows the crosshair or latest visible candle. Each line starts after its period plus one close (RSI(24) needs 25). These zones describe momentum and do not confirm a reversal.
OI is one panel: the line is open interest at each candle’s close, coloured by price and OI together, and the bars below it are the change from the previous candle (green net opening, red net closing). FR shows the funding rate in force as steps, green above zero and red below, with Binance’s 0.01% base line; at the latest candle it adds Binance’s live estimate for the next settlement and the time left. L/S draws LSUR Retail, TTSI Top accounts and TTMU Top positions on one ratio scale around Neutral 1.00. Basis is the perpetual’s premium or discount to the spot index. Binance keeps L/S and Basis for 30 days, so older candles show “Binance keeps 30 days · data from …”. All four are context, not direction calls.
Taker Flow, Large Trades, Trade Count and Liquidations need a signed-in account; without a session they stay off and show a lock. Taker Flow combines Binance Spot and USD-M taker buys (green) and sells (red) per candle, and its CVD line has its own scale; it shows who was in control, not where price goes next. Trade Count, Large Trades and Liquidations show trades, large trades and forced orders per candle, and zoom and scroll with the chart; Large Trades starts 15 minutes before the chart opened and Liquidations when it opened (Binance keeps no history). All of them read Binance directly from your device.
Under the chart controls, Forecast shows the Market Forecast for this coin only for a horizon whose model passed testing on unseen data, as Bullish / Neutral / Bearish chances next to the usual rate. Otherwise it says “No reliable forecast for this coin”. The edge is small: use it as context next to your own signals.
The TD chip shows TD Sequential 9 / 13 as exhaustion or continuation context, never a reversal order. Define invalidation, size and reward-to-risk yourself.
Use the left toolbar on desktop or Drawing tools above the chart on a phone. Cross cursor inspects candles and pans; Cursor selects drawings, drags them, or moves their anchor handles. Text and Horizontal line use one tap; Pen follows a drag. Triangle uses three corners. Parallel channel uses two ends of a boundary and a third point on the other boundary. Fibonacci uses two swing endpoints; 0% is at the second point and 100% at the first. Measure uses two points for price change, percentage, candle distance and elapsed time. Two fingers zoom without drawing.
Long position: tap entry, target above entry, then stop below entry; it shows the price levels and reward-to-risk ratio, not an order, position size, fees or slippage. Drawings are saved locally and synced to your signed-in account per user and symbol; open My Chart on another signed-in device to restore them. Offline edits stay on this device and retry when the chart reconnects. Current-timeframe visibility is the default. Use Undo, Redo, Delete selected, Edit text or the colour palette. To recolour an existing drawing, choose Cursor and tap its line; circular handles identify the selection. The palette shows its current colour, a checkmark and hex codes. A colour changes the selected drawing (all Fibonacci levels together); without a selection it applies to new drawings. Clear all drawings asks for confirmation and can be undone.
Double-click or double-tap a Fibonacci line (also while the drawing tool is active) to open settings. Style & Levels controls extension, colour per level or one colour, custom hex colours, line style/thickness/opacity, labels, trend connector and background shading. Add levels and optional 1.382/1.618/2.618 extensions. Anchors edits prices and dates in your timezone, swaps endpoints or snaps to loaded candle highs/lows. Visibility optionally shares the drawing across this symbol’s selected timeframe groups. Changes preview immediately; Save makes one undoable edit, Cancel restores the original. Save as default affects new drawings only. The selection toolbar offers Settings, Lock/Unlock, Duplicate and Delete.
Tap a coloured level square to open the full palette: grayscale and colour shades, a selected-colour checkmark, custom hex and opacity. Swatch taps preview only; Save applies the colour, Cancel discards it. Level squares remain clickable even when Use one colour is on: saving a level colour switches to per-level mode and keeps other levels unchanged. The top common-colour control applies one colour to all levels. Save the Fibonacci settings to keep the drawing changes. The drawing toolbar also offers Open colour palette.
Select the drawing to show its circular handles. Drag either unlocked endpoint directly in Cross Cursor, Fibonacci or Cursor mode; the other endpoint stays fixed. Touch targets are larger than the visible circles. Cursor drags the whole drawing from a line, or use its optional trend connector. If locked, use the padlock to unlock it first. Releasing saves one undoable edit; cancelling discards it. A second finger cancels the pending edit and switches to pinch zoom without scrolling the page or loading history.
Choose Measure, then drag with the mouse or one finger; two taps also work. A live shaded rectangle shows signed endpoint price/percentage change, candle distance, elapsed days/hours/minutes/seconds and total candle volume. Volume includes both endpoint candles and uses only loaded data; unavailable volume displays — rather than a partial sum. Candle distance counts chart intervals, not inclusive candle count; elapsed time uses timestamps, so data gaps can differ. Release saves one undoable range. Cursor selects its shaded interior to move it or its endpoint handles to resize it. Two fingers cancel placement and zoom. This is a chart measurement, not trade P&L.
How to read this widget
Use these points to interpret the visible values before moving to a related record or decision.
The body shows the open and close for that period; the wick above and below shows the high and low reached during it. Body colour shows whether the close was above or below the open.
Overlays and every panel below the chart are calculated from the same candles and stay aligned when you zoom or pan; one crosshair reads them all at the same candle.
Scroll to zoom in on a cluster of candles or out for broader context. Zooming changes what you can see, not the underlying data — confirm any reading against the current timeframe and symbol.
Field reference
Use these definitions to interpret the widget consistently across cryptocurrency and stock markets.
| Field | Meaning | Practical use |
|---|---|---|
| RSI(6,12,24) | Three Wilder-smoothed relative strength lines on loaded closes (RSI1 fast, RSI2 medium, RSI3 slow), from 0 to 100; RSI(24) needs 25 closes. | Read at the crosshair or latest visible candle. 70 or above is overbought; 30 or below is oversold; the status follows RSI(12). Neither zone confirms a reversal. |
| EMA / BBI | EMA(7,25,99) uses exponential averages; BBI averages SMA(3,6,12,24). | Compare price with the lines at the same candle. MA uses simple averages. |
| KDJ(9,3,3) | KDJ(9,3,3) smooths high/low/close momentum. J = 3K − 2D can exceed 0–100. | Use 20/80 reference lines with price structure; extremes do not confirm a reversal. |
| OBV(30) | OBV: cumulative volume added on rising closes and subtracted on falling closes, starting at zero in loaded history. MAOBV: its 30-candle average. | Compare direction with price; OBV crossing above MAOBV reads as buying pressure picking up, below as it fading. Absolute values can shift when older history loads. |
| AO / BRAR(26) | AO is SMA(5) minus SMA(34) of median price. BRAR compares intrabar and previous-close buying/selling pressure around a neutral 100 level. | Use AO for momentum direction and BRAR for pressure context. Extremes and zero/100 crossings need confirmation from price structure. |
| Taker Flow / CVD | Combined Binance Spot and USD-M aggressive buy and sell quote volume. CVD cumulatively adds buy minus sell flow from the loaded history, on its own scale fitted to the visible candles (the readout shows its actual value). | Read who is in control: price and CVD rising together means buyers are pushing, falling together sellers. It is not a forecast. |
| Forecast | The Market Forecast for this coin, shown only for a horizon whose model beat the usual frequencies on unseen past data (Promising), with the usual rate next to each chance. | Context next to your own signals; the edge is small. "No reliable forecast" means no tested model for this coin right now. |
| Trade Count | Binance USD-M trades per candle, from Binance’s own candles, so every candle has a count; it zooms and scrolls with the chart. Green when takers bought more than they sold in that candle, red when they sold more. | Compare with Volume: a high count on modest volume means many small trades, a low count on big volume a few large ones. The readout gives the candle’s count and taker-buy share. |
| Large Trades | Per candle, Binance USD-M trades at or above the 95th percentile size this device has seen for the coin (the readout gives the size), buys up and sells down; it zooms and scrolls with the chart. | Shows where size hit the market; a one-sided run of large prints adds weight to a move. Trades come straight from Binance to your device (the last 15 minutes first, then live), so earlier candles, or candles while the app was closed, have no bar. |
| SAR(0.02,0.2) | Parabolic SAR dots: green below rising candles, red above falling ones; they flip sides when price crosses them. | Use as a trailing stop or trend-change marker; it whipsaws in sideways markets. |
| DC(20) | Donchian Channel: highest high (UP) and lowest low (LOW) of the last 20 candles, and their midpoint (MID). | A close beyond UP or LOW is a 20-candle breakout; a narrow channel shows a quiet market. |
| DMI(14,14) | As TradingView draws it: +DI and −DI measure upward and downward movement (Wilder-smoothed over 14 candles); ADX measures trend strength regardless of direction. | +DI above −DI favours the bulls. ADX above 25 is a trending market, below 20 a ranging one. |
| StochRSI(14,14,3,3) | Where RSI(14) sits in its own 14-candle range, smoothed into K and D (0–100). | 80 or above is overbought, 20 or below oversold; faster and noisier than RSI. A K/D cross can mark an early turn. |
| OI | Open interest in one panel: the line is the Binance USD-M futures contracts still open at each candle’s close (stored every 5 minutes); the bars below it are the change from the previous candle. The readout shows OI with its % change, the change (Δ) and its approximate USDT value. | Line colours combine price and OI changes: green means both rising/new participation; orange means price down/OI up/new shorts; blue means price up/OI down/possible short covering; red means both down/possible long liquidation. Green bars are net opening, red net closing; they do not say whether longs or shorts, so read them with the line colours. Context, not proof of trader direction. Latest pending shows the last valid value and time; No data means no visible OI history. |
| Liquidations | USD-M forced liquidations per candle, from Binance’s live stream while the chart is open; it zooms and scrolls with the chart. Binance keeps no history, so candles before the stream started (shown as “since HH:MM”) have no bar. | Red is forced selling that closes longs; green is forced buying that closes shorts. Binance emits at most the latest event per symbol each second, so totals are not exhaustive. |
| Chart style | In Indicators: Simple (price, moving average, volume), Trader (adds MACD, RSI, Bollinger Bands) or Pro (adds order flow and derivatives). New users start on Simple; changing any indicator makes it Custom. | Pick a style to start, then add what you need. Indicators are grouped by purpose and each abbreviation shows its full name. |
| Full screen | The expand button beside each panel’s drag handle opens that panel across the whole chart area. On a phone it is one button showing ⠿⤢: tap it for full screen, or hold it to move the panel. | Zoom and scroll work as usual; press the button again to bring back the price chart and the other panels. |
| Price alerts | From the bell beside the timeframes (its badge counts the coin’s alerts that are on): alerts when the coin rises to or falls to a price, Once only, Once a day or Every time; up to 10 per coin, saved to your account. | The app checks Binance’s price on your device, so an alert fires while the app is open on any of your devices and shows as a notification. |
| Edit panels | From ⋯ when panels are open: ↑ and ↓ move each panel, ✕ removes it; Done ends editing. | The same as dragging a panel by its handle (hold the expand button on a phone), with buttons that are easier to hit. |
| First-visit tour | Three short cards on your first visit: zoom and move, price alerts and sharing, and panels. | Skip or Got it closes it for good on this device. |
| Share | From ⋯: the chart as you see it, as an image. | Phones and the web open the share menu (WhatsApp, Telegram, X, Save…); desktop saves the image. |
| FR | Funding rate in force at each candle’s close, in percent, as steps: green shading above zero (longs pay shorts), red below (shorts pay longs), with a dashed line at Binance’s usual 0.01% base. The readout adds the yearly equivalent and, at the latest candle, Binance’s live estimate for the next settlement and the time left. | High (0.05% or more per 8 hours) and Extreme (0.1% or more) mark crowded positioning, which often comes before a squeeze. Settlement is every 8 hours on most coins, 4 or 1 on some. |
| KC(20,10,2) | Keltner Channel: EMA(20) middle line (MID) with bands 2 × ATR(10) above (UP) and below (LOW). | A close outside the bands shows a strong move; BOLL inside the Keltner bands (a squeeze) often comes before a breakout. |
| Ichimoku(9,26,52) | Tenkan and Kijun are the 9- and 26-candle midpoints; the cloud between Span A and Span B is drawn 26 candles ahead and Chikou (the close) 26 behind. | Price above the cloud favours an uptrend, below it a downtrend; Tenkan crossing Kijun marks a shift. The cloud ahead of the last candle is not drawn. |
| L/S | Binance long/short ratios (longs ÷ shorts) on one shared scale: LSUR Retail (all accounts), TTSI Top accounts (top traders by account count) and TTMU Top positions (top traders by position size), around a Neutral 1.00 line. | Above 1 means more longs. Compare the crowd (LSUR) with top traders (TTSI, TTMU); the crowd often leans the wrong way at turns. Binance keeps 30 days: older candles show “Binance keeps 30 days · data from …”. |
| Basis | How far the perpetual trades above (+) or below (−) Binance’s spot index, in percent. | A wide premium shows eager longs, a discount eager shorts; it usually moves with funding. Each candle shows the basis at its close. Binance keeps 30 days: older candles show “Binance keeps 30 days · data from …”. |
| OHLC candle | Open, high, low, and close for one interval. | Read body and wick together to identify rejection, continuation, and range expansion. |
| MA / Bollinger Bands | Trend smoothing and volatility envelope. | Bands describe relative expansion, not fixed support or resistance. |
| Volume | Traded volume per candle, with MA(5) and MA(10) lines over the bars. | Confirm breakouts with participation; low-volume moves are easier to reverse. |
| TD Sequential | A counted exhaustion/continuation sequence. Down N (red, below the candles) counts closes below the close four candles earlier; Up N (green, above) counts closes above it. The candle colour compares a candle with its own open, so a green candle can be part of a Down count. | A 9 or 13 is a setup for review, not a standalone reversal order. |
| MACD(10,22,8) | DIF is the 10-candle EMA minus the 22-candle EMA, DEA is DIF’s 8-candle EMA, and the bars (MACD) are DIF minus DEA. | Bars growing away from zero show strengthening momentum, shrinking bars fading momentum; a DIF/DEA cross marks a shift. Compare with price structure rather than relying on one indicator. |
| Panel values and time | Move the mouse over, or touch, any panel to see its value at the pointer on the right axis and the candle time below; every panel follows the same crosshair. | Read all panels at the same candle. The forming candle and its indicators update live until it closes. |
| Account panels | Taker Flow, Large Trades, Trade Count and Liquidations read trades straight from Binance on your device and need a signed-in account. | Without a session they stay off and show a lock; your choice is kept and comes back after you sign in. |
Use exchange volume, ATR, and liquidation context; thin pairs can print misleading wicks.
Use split-adjusted prices, session volume, gap context, and earnings/news calendars; TD and moving averages do not account for fundamentals.
My Coin Trends provides market information and technical signals. It is not investment advice. Verify every signal against current market structure, liquidity, and your own risk limits before making a trading decision.