
Market Confirmation
Inside the Confirmation Panel: What KDJ, BBI, and Every Evidence Tag Really Mean
A field-by-field tour of the Market Confirmation Insights panel — including why the scoring model uses full KDJ instead of plain Stochastic, and exactly how a score like 58/100 gets built from independent evidence.
By admin · Updated 06 September 2026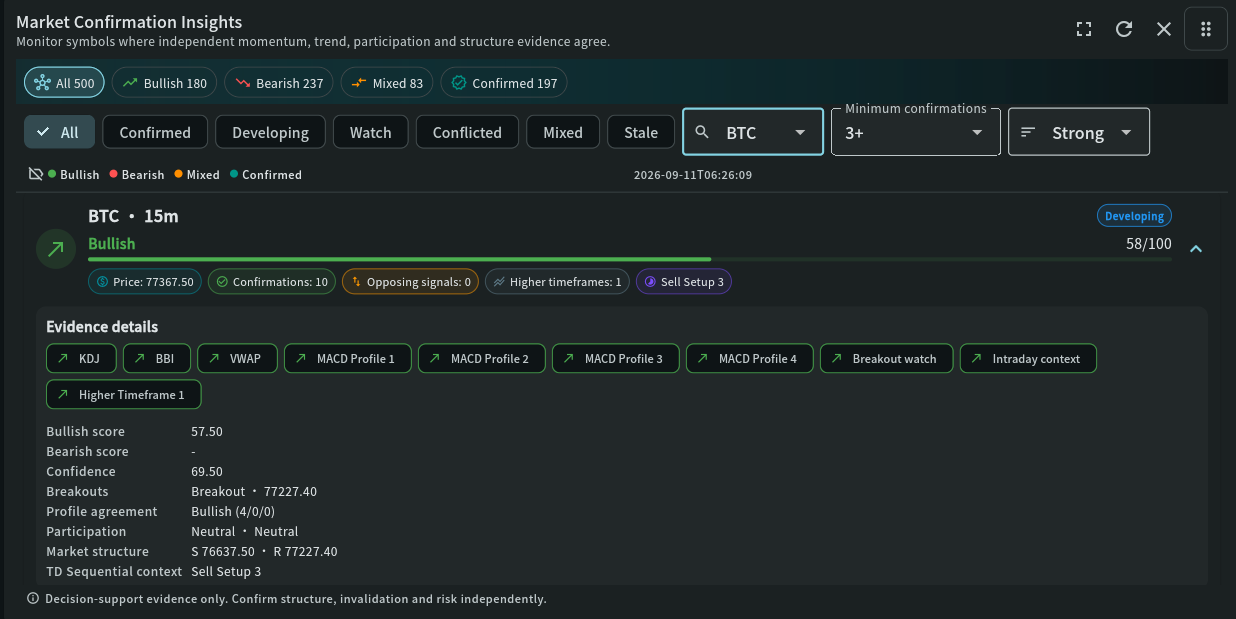
Screenshot, decoded
Reading this panel
This screenshot is a real BTC · 15m confirmation row. Every badge and number on it is explained below, in the order it appears.
Universe summary — All 500 / Bullish 180 / Bearish 237 / Mixed 83 / Confirmed 197
A live count across every symbol and timeframe currently being scanned, before you filter to one. Use it to gauge whether the broad market is leaning one way before drilling into a single candidate.
Status tabs — All, Confirmed, Developing, Watch, Conflicted, Mixed, Stale
These are maturity filters, not directions. A row becomes Confirmed only once its dominant score reaches a high threshold, several independent sources agree, and at least one higher timeframe matches. Developing needs a meaningfully lower score and fewer agreeing sources; Watch needs less still. Conflicted means the two sides are too close together, or enough opposing evidence exists, regardless of the score. Stale means the underlying data is too old to trust, whatever the last known score was.
Search, minimum confirmations, and sort
Narrow the list to one symbol, require a minimum number of agreeing sources before a row is even shown, and sort by confluence strength — filters that shape which candidates you see, not the evidence itself.
Row header — BTC · 15m, direction arrow, score, status badge
One row is always one exact symbol-and-timeframe combination. The arrow and "Bullish" label show the dominant side; the bar and "58/100" is that side's confluence score; "Developing" (top right) is the maturity status explained above — here it has enough score and enough sources to be Developing, but not yet enough to be Confirmed.
Sub-badges — Price, Confirmations, Opposing signals, Higher timeframes, TD context
Price is the current traded price. Confirmations (10) counts independent sources agreeing with the dominant direction. Opposing signals (0) counts sources actively disagreeing — a low number here is what lets a high score stay trustworthy. Higher timeframes (1) counts adjacent, longer timeframes that independently agree. "Sell Setup 3" is TD Sequential risk context, explained further down — it never adds to or subtracts from the score.
Evidence details tags — KDJ, BBI, VWAP, MACD Profile 1–4, Breakout watch, Intraday context, Higher Timeframe 1
Each tag is one independent piece of evidence that voted for the dominant direction. They do not all carry equal weight: the scanner's own trend read and MACD profile agreement together carry the most, a confirmed breakout adds a large amount on its own, and single indicator families like KDJ, BBI, or VWAP each contribute a smaller, equal share. Tap a tag in the real app to see exactly what it detected.
Bullish score / Bearish score
The weighted sum of every agreeing source on each side, each capped at 100. Usually only one side has a meaningful score in a clean read ("Bearish score: -" here means nothing voted bearish) — seeing sizeable numbers on both sides at once is exactly what pushes a row toward Conflicted status.
Confidence
Not the same number as the confluence score above — this is the scanner's own, independent confidence in its trend read for this candle, reported separately so you can see whether the scanner agrees with itself as strongly as the combined panel does.
Breakouts
The current breakout classification (a plain "Breakout" here) and the price level it broke through. A raw Breakout is real structural evidence, but by itself it is only one of the many sources feeding the score above — it becomes far more influential once it is promoted to Confirmed.
Profile agreement
How many of the configured MACD profiles are bullish, bearish, or neutral, shown as a count tuple. "Bullish (4/0/0)" means all four active profiles read bullish, zero bearish, zero neutral — full agreement across every configured MACD speed, from the fastest to the slowest.
Participation
Price/OI participation, volume or ATR expansion, and higher-timeframe agreement, condensed into one line. "Neutral · Neutral" here means neither the participation data nor the expansion check is currently adding weight either way — worth noting even when everything else on the row looks strong.
Market structure
The nearest support (S) and resistance (R) levels the scanner is tracking for this symbol and timeframe right now — your natural reference points for invalidation.
TD Sequential context
"Sell Setup 3" means a TD Sell Setup count is at bar 3 of the 9 needed to complete — an early, incomplete count shown purely as exhaustion/continuation risk context. It never casts a directional vote in the score above; treat it as a reason to tighten risk management, never as a standalone signal.
Footer note
"Decision-support evidence only" is not boilerplate — it is the panel telling you directly that a high score is a reason to investigate further, not an instruction to act.
Key terms
Indicator definitions
What each term means in My Coin Trends, and why it matters when you're reading the widget.
| Term | Definition | Why it matters |
|---|---|---|
| %K / %D (Stochastic) | The classic stochastic oscillator: %K measures where the current close sits within a recent high/low range, and %D is a smoothed moving average of %K. Both are bounded to 0–100. | Useful for reading overbought/oversold conditions, but because both lines are capped, they can compress and understate how extreme a fast move has actually become. |
| K / D (KDJ) | Calculated the same way as classic Stochastic %K/%D — this product uses a 9-period base value with 3-period smoothing on each line, the standard "9, 3, 3" KDJ configuration. | Provides the same base overbought/oversold reading as Stochastic, kept directly comparable to the classic indicator. |
| J line | J = 3×K − 2×D, intentionally not clamped to 0–100. | Because it is uncapped, J overshoots earlier and further than K or D during a fast move — earlier warning of an extreme, and earlier warning of a recovery out of one, than K/D alone can show. |
Worked example
Walking through it
Illustrative walkthrough of what the three lines look like during a sharp move, not a live signal.
- Momentum accelerates
Price pushes sharply higher. %K climbs quickly toward 100 and %D follows, smoothed and slightly behind.
- K and D compress near the ceiling
As %K approaches 100 it has nowhere further to go — the classic Stochastic reading looks "maxed out" but stays flat, offering no further information about how much more extreme the move is getting.
- J keeps extending
Because J = 3K − 2D is not capped, it continues pushing well past 100 while K and D stay pinned near their ceiling. That growing gap between J and the K/D pair is the early-warning signal — momentum is still accelerating even though the classic oscillator alone looks saturated.
- J turns down first
When the move exhausts, J typically peaks and rolls over before K and D visibly change direction, since J reacts to the same underlying shift with more amplitude.
Treat a large, sustained J overshoot as an early-warning flag worth watching, not a standalone entry or exit signal. It tells you momentum is unusually stretched; it does not tell you when the reversal will actually happen. Confirm with price structure, volume/ATR expansion, and other independent evidence before acting.
Read this before you rely on it
Limitations and conflicting evidence
A J overshoot can persist for a long time during a genuinely strong trend — treating every extreme reading as an imminent reversal will generate false early warnings in trending markets. J is one input among several; this product treats KDJ as supporting evidence alongside EMA, MACD, BBI, and price structure, never as a standalone directional vote. J’s lack of an upper/lower bound also means it cannot be read on a fixed 0–100 scale the way K and D can — compare its recent range, not an absolute number. Profile agreement, participation, and TD context are each condensed to one line on the row above; expand a row in the real app to see every contributing source's exact value rather than relying on the summary alone.
Go deeper
Related widget documentation
Market Confirmation Insights
Rank symbols where independent scanner, momentum, trend, participation, structure, and higher-timeframe evidence agree—and expose conflicts before a decision is made.
Open documentation →Scanner Intelligence
Investigate market rotation, opportunity progression, multi-timeframe confluence, replay evidence, and measured trade outcomes in one connected workspace.
Open documentation →Risk notice
My Coin Trends provides market information and technical signals. It is not investment advice. Verify every signal against current market structure, liquidity, and your own risk limits before making a trading decision.This article is educational content describing how My Coin Trends' indicators work; it is not a recommendation to buy, sell, or hold any asset.