
Market Structure
Support, Resistance, ATR, and Volume: Reading the Structural Evidence Behind Every Breakout
Using a real Signal Replay crosshair reading, this walkthrough shows exactly how support and resistance levels are set, and what the Volume× and ATR× expansion ratios need to show before a break counts as real participation.
By admin · Updated 02 September 2026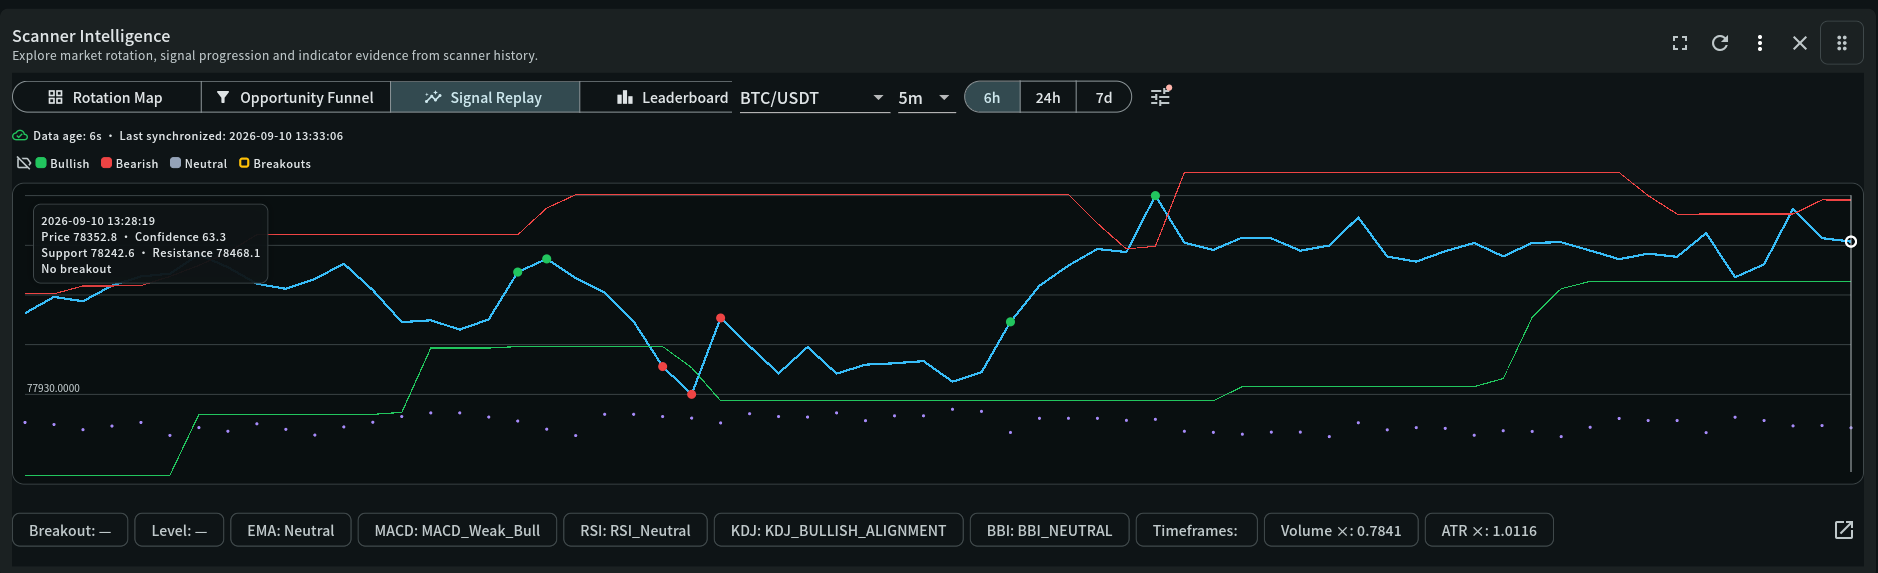
Screenshot, decoded
Reading this panel
The same Signal Replay view used elsewhere in this Learning Centre — here, read specifically for its structure and expansion fields.
Step lines on the chart
The green and red stepped lines are the current support and resistance levels for this symbol and timeframe, recalculated from the recent rolling price range as new candles form — they move in steps, not smoothly, because they only update when the underlying range actually changes.
Crosshair tooltip — Support and Resistance values
At the inspected moment: "Support 78242.6 · Resistance 78468.1", with price at 78352.8 sitting between them, and "No breakout" confirming price has not cleared either level yet at that point in time.
Evidence bar — Breakout and Level
"Breakout: —" and "Level: —" here mean no break is currently active for this reading; once one is, this pair reports its status and the exact price level that was broken.
Evidence bar — Volume × and ATR ×
These are ratios against each measure's own recent baseline, not absolute numbers — 1.0× means exactly typical. "Volume ×: 0.7841" and "ATR ×: 1.0116" here are both close to or below 1×, meaning neither volume nor volatility is currently expanded, which is exactly why this reading shows no breakout evidence building.
Event markers on the price line
Green and red dots mark past bullish and bearish evidence directly on the price line, letting you see at a glance where prior breaks or events happened relative to the current support/resistance steps.
Key terms
Indicator definitions
What each term means in My Coin Trends, and why it matters when you're reading the widget.
| Term | Definition | Why it matters |
|---|---|---|
| Support / resistance | The recent rolling low and high the price has respected, recalculated as new candles form rather than fixed by hand. | Your natural reference points for where a break becomes structurally meaningful, and where an invalidation level for a trade would naturally sit. |
| Volume expansion | Current volume expressed as a ratio against its own recent typical level — a value meaningfully above 1× indicates unusually high participation. | A break on expanding volume has real trading interest behind it; a break on volume still near or below 1× is a quieter, less convincing move. |
| ATR (average true range) expansion | A ratio comparing current volatility to its own recent typical level, using average true range as the volatility measure. | Distinguishes a break happening during a genuine volatility expansion from one drifting past a level during an otherwise quiet period. |
Worked example
Walking through it
Using the exact numbers from the screenshot above to show why this particular reading is not flagged as a breakout.
- Price sits inside the range
78352.8 is between the support at 78242.6 and resistance at 78468.1 — by definition, not a break in either direction yet.
- Volume is below typical
0.7841× means current volume is running about 22% below its recent baseline — the opposite of the expansion a real breakout needs.
- ATR is close to typical
1.0116× is essentially normal volatility — no sign of the market becoming more active than usual.
- Conclusion: no breakout evidence
With price inside the range and neither volume nor volatility expanded, "No breakout" is exactly the expected read — there is nothing here yet worth treating as a structural break.
Before trusting any breakout, check the same three things this example shows: is price actually beyond a level, is volume expanded, and is volatility expanded? All three missing (as here) means wait; all three present is a materially stronger case than price alone.
Read this before you rely on it
Limitations and conflicting evidence
Support and resistance recalculate from a rolling window, so a level that looked solid can shift as new candles form — a level from several candles ago is not guaranteed to still be the level the app is currently using. Volume and ATR ratios describe participation and volatility, not direction — a high ratio on its own does not tell you which way price is likely to move, only that the move (whichever direction it turns out to be) is more likely to be real. Thin-liquidity symbols can show volume spikes from a handful of large orders rather than broad participation, which these ratios cannot distinguish on their own.
Go deeper
Related widget documentation
Scanner Intelligence
Investigate market rotation, opportunity progression, multi-timeframe confluence, replay evidence, and measured trade outcomes in one connected workspace.
Open documentation →Price Action Insights
Visualise price movement as candlesticks with moving average, Bollinger Bands, MACD, volume, and TD Sequential overlays.
Open documentation →Risk notice
My Coin Trends provides market information and technical signals. It is not investment advice. Verify every signal against current market structure, liquidity, and your own risk limits before making a trading decision.This article is educational content describing how My Coin Trends' indicators work; it is not a recommendation to buy, sell, or hold any asset.