
Trend Indicators
What Is BBI, and Why Average Four Moving Averages Into One Line?
BBI compresses four moving averages of different speeds into a single trend line, so a reader who checks one number gets a view that already accounts for short- and long-term trend agreement.
By admin · Updated 03 September 2026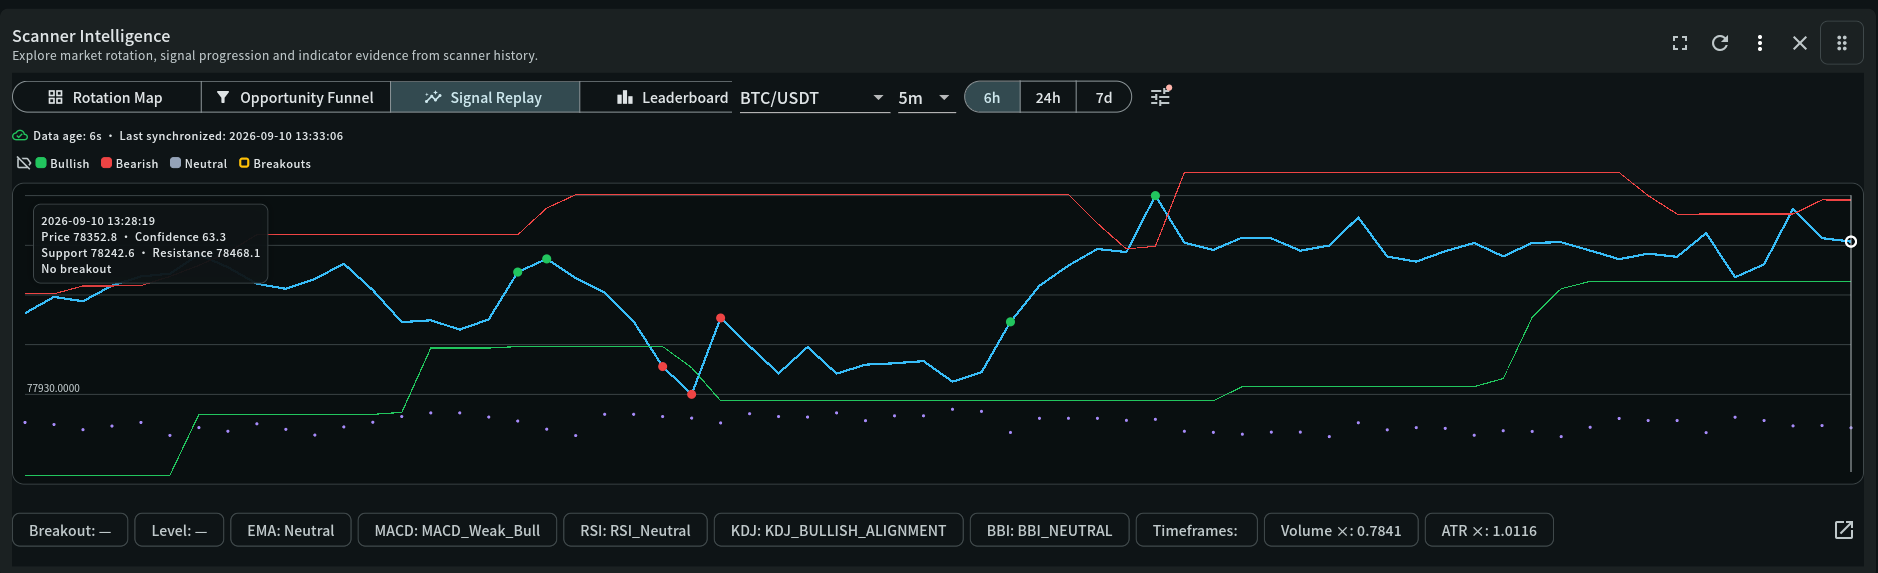
Screenshot, decoded
Reading this panel
BBI is one line in the evidence bar at the bottom of Signal Replay. Here is how to read that tag, and the rest of the panel around it, when you are specifically checking trend agreement.
BBI evidence tag
Reads BBI_NEUTRAL here, meaning price is not clearly and consistently on one side of the BBI line right now. The other two states are BBI_BULLISH (price above a rising BBI) and BBI_BEARISH (price below a falling BBI) — described further in the indicator definitions below.
Price line and support/resistance steps
BBI is calculated from the same candles as the blue price line. A BBI read only means something in the context of where price actually is relative to the current support and resistance steps — check both together, not the tag alone.
Crosshair tooltip
Move the crosshair to any point in the replay to see the exact price, confidence, support, and resistance at that moment — the same moment the BBI tag in the evidence bar describes.
Neighboring tags — EMA, MACD, RSI, KDJ
BBI is one of several trend/momentum families shown side by side. A BBI_NEUTRAL reading next to a clearly bullish EMA and MACD tells a different story than BBI_NEUTRAL next to tags that are themselves mixed — read the row, not one tag in isolation.
Key terms
Indicator definitions
What each term means in My Coin Trends, and why it matters when you're reading the widget.
| Term | Definition | Why it matters |
|---|---|---|
| BBI | The simple average of the 3-, 6-, 12-, and 24-period moving averages, calculated on the same candle series. | One number that already blends a fast and a slow trend read, instead of forcing you to reconcile four separate moving-average lines yourself. |
| BBI cross | The state when price moves from one side of the BBI line to the other. | Flags a fresh potential change in trend — the newest, least-confirmed of the two BBI reads. |
| BBI alignment | The state when BBI itself is trending (rising or falling) and price has stayed on the expected side of it. | A steadier, more established read than a cross — BBI agreeing with its own direction as well as price's position is a stronger combination than either alone. |
Worked example
Walking through it
Illustrative walkthrough of how a cross becomes an alignment, not a live signal.
- Price crosses above BBI
After trading below BBI for a while, price closes above it. This alone is a bullish cross — fresh, but BBI itself may still be flat or falling from the recent downtrend.
- BBI starts rising too
As the faster moving averages inside BBI catch up to the higher prices, the BBI line itself turns upward.
- The read upgrades to alignment
With price above BBI and BBI itself rising, the state becomes a bullish alignment — a more established read than the original cross, because both the level and the slope now agree.
- A pullback that stays above BBI is not a new signal
A minor dip that never actually closes back below the BBI line does not reset the state. Only a genuine cross back to the other side does.
A cross tells you something just changed; an alignment tells you the change has held. Weight a fresh cross less than an established alignment, and watch for the upgrade from one to the other as confirmation.
Read this before you rely on it
Limitations and conflicting evidence
BBI, like any moving-average-based tool, lags — by the time a cross or alignment appears, part of the move has already happened. In a genuinely choppy, range-bound market, price can cross a flat BBI line repeatedly without any of the crosses developing into a real trend, producing several low-value signals in a row. My Coin Trends treats BBI as one evidence family among several (alongside EMA, MACD, KDJ, and price structure) specifically because of this — never act on a BBI read alone.
Go deeper
Related widget documentation
Scanner Intelligence
Investigate market rotation, opportunity progression, multi-timeframe confluence, replay evidence, and measured trade outcomes in one connected workspace.
Open documentation →Market Confirmation Insights
Rank symbols where independent scanner, momentum, trend, participation, structure, and higher-timeframe evidence agree—and expose conflicts before a decision is made.
Open documentation →Risk notice
My Coin Trends provides market information and technical signals. It is not investment advice. Verify every signal against current market structure, liquidity, and your own risk limits before making a trading decision.This article is educational content describing how My Coin Trends' indicators work; it is not a recommendation to buy, sell, or hold any asset.