
Market Structure
Price vs. Open Interest: How to Read Every Signal on the Panel
A full walkthrough of the Price / OI Insights panel — what Composite Score, OI Anomaly, Signal Persistence, and every confluence card actually measure, using the exact numbers from a real screenshot.
By admin · Updated 30 August 2026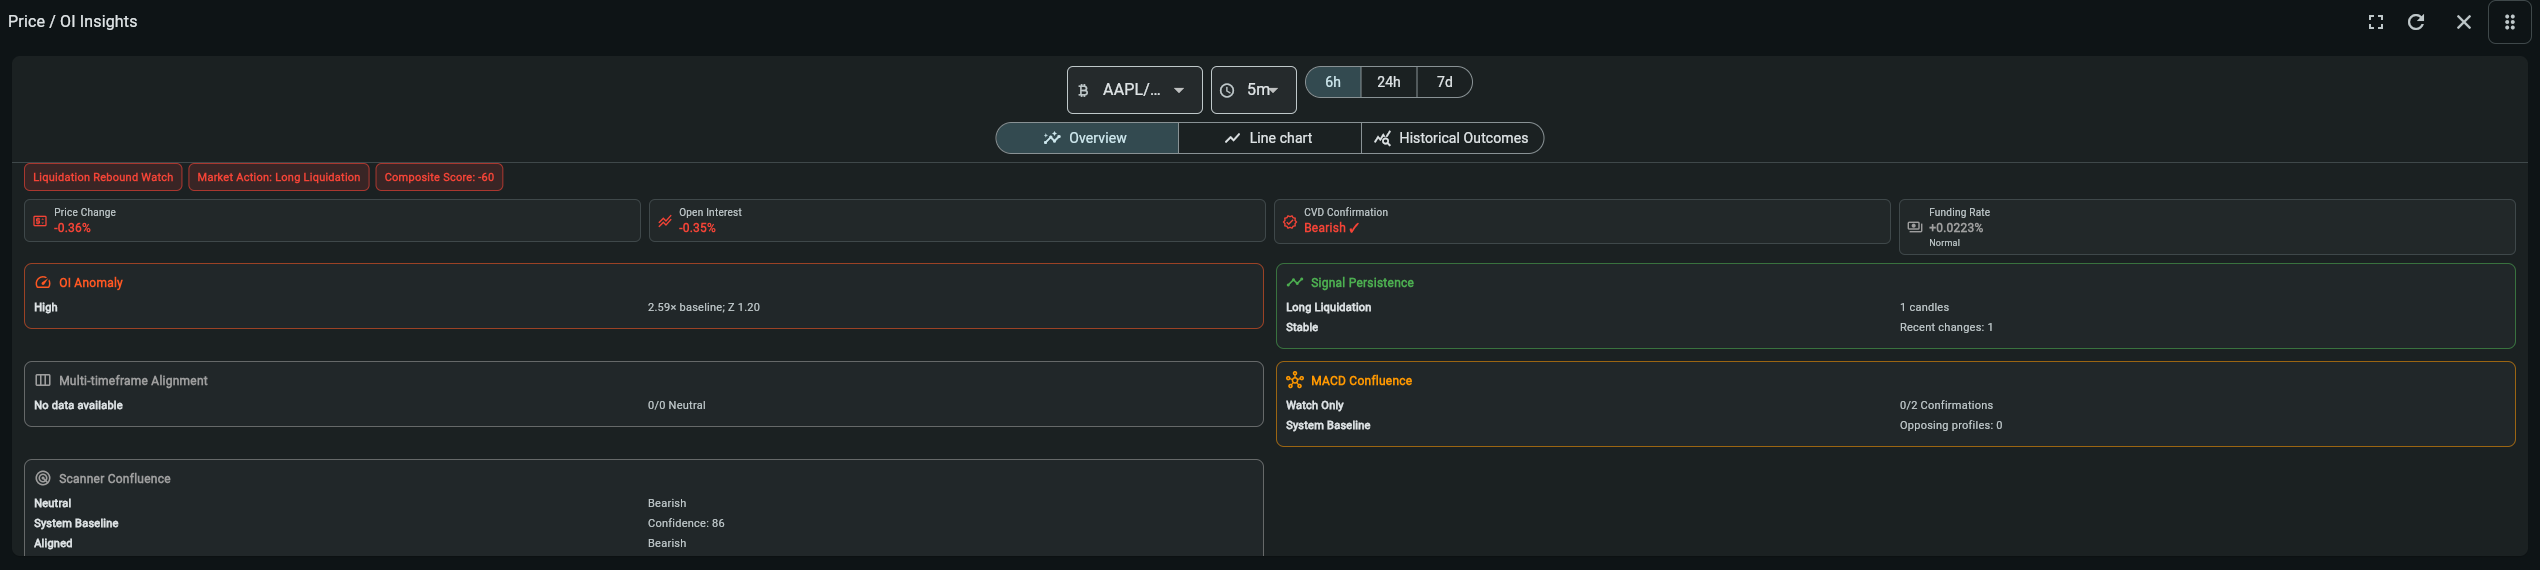
Screenshot, decoded
Reading this panel
Every label in the screenshot above comes from one of four independent checks: the price/OI relationship itself, how unusual the OI move is, how long the current read has held, and whether other sources (MACD, the scanner) agree. Here is what each one means, in the order it appears.
Symbol, timeframe, and period controls
Choose the instrument, candle interval, and lookback window (6h / 24h / 7d) for the panel below. Every card described here reflects that exact symbol and timeframe — change either and every card updates together.
Overview / Line chart / Historical Outcomes tabs
Overview (shown here) is the confluence panel described below. Line chart plots price and OI over time instead of a single snapshot. Historical Outcomes shows what happened after past readings like this one, where tenant trade records exist.
Top status badges — Market Action and Composite Score
The action label (e.g. "Market Action: Long Liquidation") comes from a simple map of price direction against OI direction: price up + OI up is New Longs (a healthy bullish trend); price down + OI down is Long Liquidation, flagged "Liquidation Rebound Watch"; price down + OI up is New Shorts (bearish continuation); price up + OI down is Short Covering, flagged "Short Squeeze Watch". Composite Score adds two more independent checks on top of that action — the worked example below shows the exact arithmetic behind the −60 in this screenshot.
Price Change / Open Interest cards
The two raw inputs to the action label above. Both are negative here (price −0.36%, OI −0.35%), which is exactly the "down + down" combination — Long Liquidation.
CVD Confirmation card
Cumulative volume delta — whether actual buy/sell order flow agrees with the market action's expected direction. A checkmark ("Bearish ✓" here) means order flow confirms it, which adds to the composite score; a mismatch would subtract instead.
Funding Rate card
The periodic payment between long and short perpetual holders. Anything roughly inside ±0.05% is treated as Normal; outside that band it flags a crowded long or crowded short position, which pulls the composite score toward whichever side is not crowded, since a crowded trade is more fragile. At +0.0223% here it is comfortably inside Normal and contributes nothing to the score.
OI Anomaly card
Compares the current OI change to its own recent baseline two ways: a multiple (how many times larger than typical) and a Z-score (how many standard deviations from typical). Either measure alone can raise the level — "High" here comes from the 2.59× multiple crossing its threshold, even though the Z-score of 1.20 alone would only reach the lower "Elevated" level. Read both numbers, not just the headline word.
Signal Persistence card
How long the current market action has held and how often it has been flipping. "1 candles" means this exact action just started on this candle; "Recent changes: 1" counts flips over roughly the last dozen candles. Three or more recent flips would mark the read "Noisy" instead of "Stable" — worth checking before leaning on a single fresh reading.
Multi-timeframe Alignment card
Compares this same symbol's price/OI read across other timeframes. "Aligned" means multiple timeframes agree on one direction; "Mixed" means they disagree; "No data available" (shown here) simply means no other timeframe had a fresh enough reading at that moment to compare — not an error, just insufficient concurrent data yet.
MACD Confluence card
Checks whether the configured MACD profiles for this symbol and timeframe agree with the price/OI direction. "Watch Only" with "0/2 Confirmations, Opposing profiles: 0" means none of the required profiles have confirmed yet, but nothing is actively contradicting the read either — a wait-and-see state, not a warning sign.
Scanner Confluence card
Compares the independent scanner's own trend read and confidence score for this symbol and timeframe against the price/OI direction — shown here as "Bearish, Confidence: 86", the same side as the action above. Two scanner-confluence sources landing on the same side as the price/OI read is meaningfully stronger evidence than the price/OI action alone.
Key terms
Indicator definitions
What each term means in My Coin Trends, and why it matters when you're reading the widget.
| Term | Definition | Why it matters |
|---|---|---|
| Price change | Percentage or normalized movement in the instrument price over the selected window. | On its own it only tells you direction, not whether that direction is backed by a real change in participation. |
| Open interest (OI) | The total outstanding value of perpetual/futures contracts that have not yet been closed. | Rising OI means new contracts are being opened; falling OI means existing positions are being closed. Combined with price direction, it separates fresh participation from position unwinding. |
| CVD (cumulative volume delta) | Order-flow evidence estimating whether recent traded volume was more buyer-initiated or seller-initiated. | Used here purely as a confirmation check on the price/OI action — it either agrees and strengthens the composite score, or disagrees and weakens it. |
| Funding rate | A periodic payment transferred between long and short perpetual holders, reflecting how crowded one side of the market is. | Extreme funding flags a crowded, potentially fragile position. It is context, not a guaranteed reversal signal. |
Worked example
Walking through it
This is not a hypothetical — it is the exact arithmetic behind the −60 Composite Score in the screenshot above.
- Start from the market action
Price and OI both fell, so the action is Long Liquidation. Each market action carries its own fixed weight, and Long Liquidation contributes −35 to the score (New Longs would add +50, Short Covering +35, New Shorts −50).
- Add the CVD confirmation
CVD confirmed the bearish read, contributing another −25. A full confirmation is worth ±25; a weak or partial disagreement is worth less, and an outright contradiction would subtract instead of add.
- Add the funding-crowding check
Funding was +0.0223%, inside the roughly ±0.05% Normal band, so it contributes 0 — no crowding bonus or penalty either way.
- Total: −35 − 25 + 0 = −60
That total is clamped to a −100…+100 range and matches the Composite Score on the panel exactly. A score at or below −25 is labeled Bearish overall (at or above +25 is Bullish; in between is Neutral) — at −60 this reading sits well past that line.
The score is not a mysterious black box — it is three independently explainable numbers added together. Whenever you see a score, you can always ask: which action set it, did order flow confirm or fight it, and was funding crowded? The cards on the panel answer exactly that.
Read this before you rely on it
Limitations and conflicting evidence
Open interest is most informative on derivatives markets with reliable OI and funding data; spot-only pairs may not expose these fields. The composite score describes the current candle's relationship, not a forecast — a −60 reading can reverse the next candle, which is exactly what Signal Persistence and Multi-timeframe Alignment are for checking. "No data available" on the alignment card is common and not a fault; wait for it to populate rather than reading an empty card as bullish or bearish. Traditional (non-crypto) markets have no equivalent to perpetual OI or funding — this entire panel is specific to derivatives markets.
Go deeper
Related widget documentation
Price / OI Insights
Compare price and open-interest states to identify participation changes around market moves.
Open documentation →Market Confirmation Insights
Rank symbols where independent scanner, momentum, trend, participation, structure, and higher-timeframe evidence agree—and expose conflicts before a decision is made.
Open documentation →Risk notice
My Coin Trends provides market information and technical signals. It is not investment advice. Verify every signal against current market structure, liquidity, and your own risk limits before making a trading decision.This article is educational content describing how My Coin Trends' indicators work; it is not a recommendation to buy, sell, or hold any asset.