
Momentum Indicators
Reading the MACD Momentum Panel: How a Score Like 88/100 Actually Gets Built
A field-by-field walkthrough of the MACD Profiles view — how the app scores signal strength, profile agreement, and stability from four MACD speeds running at once, using the exact numbers from a real screenshot.
By admin · Updated 05 September 2026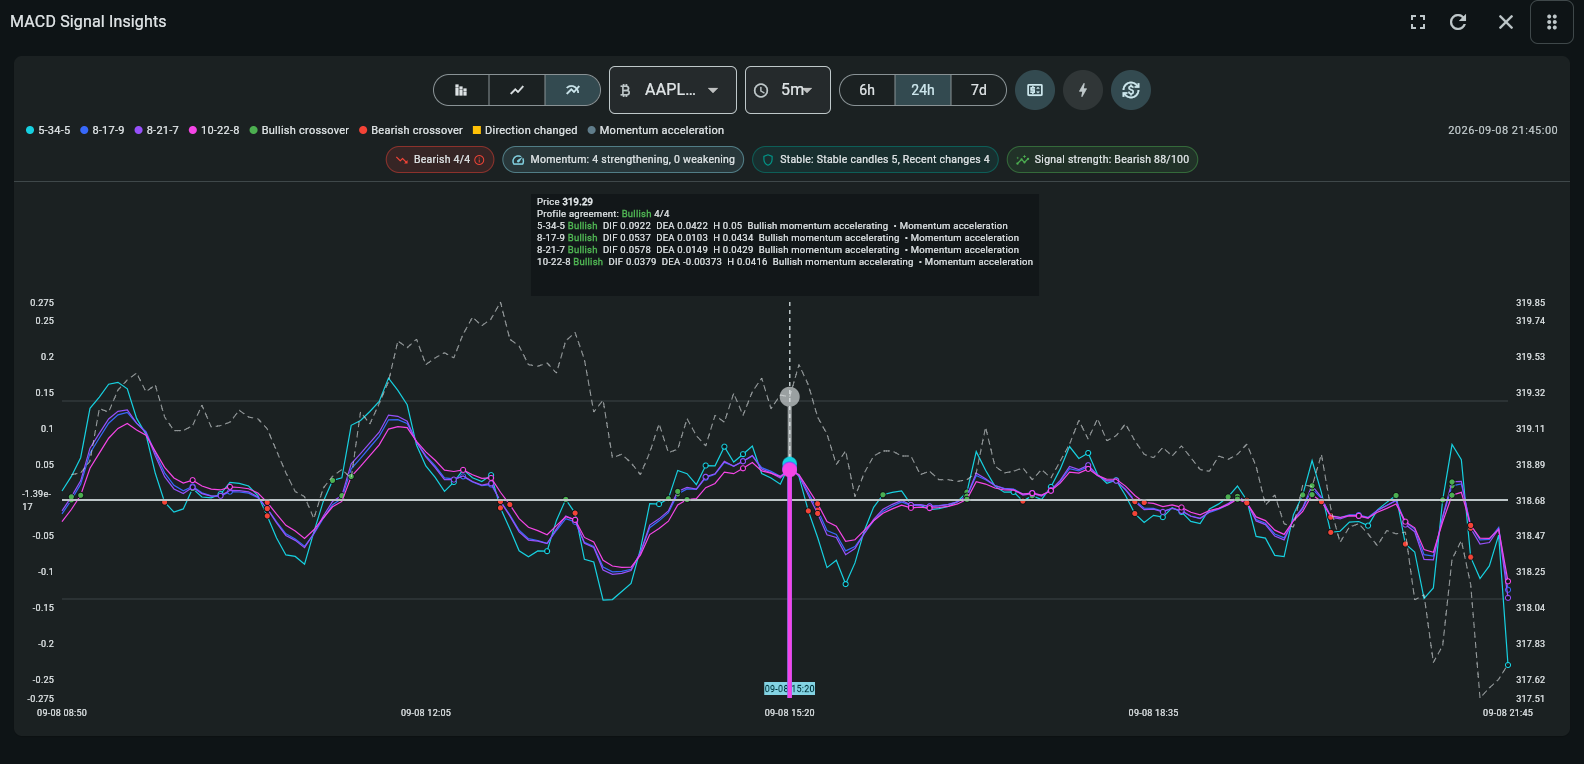
Screenshot, decoded
Reading this panel
This is the MACD Profiles view — one of three tabs in MACD Signal Insights. Everything below is calculated by the app itself from the four profiles' raw values, not a single combined line.
View tabs and controls
Market Breadth, Signal Timeline, and MACD Profiles (selected here) are three ways to look at the same four profiles. Symbol, timeframe (5m here), and period (6h / 24h selected / 7d) scope everything below to one exact chart.
Legend — four profiles and four marker types
The colored dots identify each of the four profiles by color. The remaining legend entries — Bullish crossover, Bearish crossover, Direction changed, Momentum acceleration — are the event markers plotted on the lines themselves, explained further down.
Top badges — direction, momentum, stability, signal strength
"Bearish 4/4" is the current overall bias: all four profiles agree bearish right now. "Momentum: 4 strengthening, 0 weakening" counts how many profiles have an accelerating histogram versus a fading one. "Stable: Stable candles 5, Recent changes 4" reports the shortest current same-direction streak among the four profiles, and how many direction flips happened across all of them in the last 6 candles. "Signal strength: Bearish 88/100" is the combined score explained in the worked example below.
Crosshair tooltip
Move the crosshair to any point to inspect that exact candle: price, "Profile agreement" (how many of the four profiles read Bullish/Bearish/Neutral at that moment — shown here as "Bullish 4/4", a different moment than the current "Bearish 4/4" badge above), and a full breakdown per profile.
Per-profile breakdown rows
Each row — e.g. "5-34-5 Bullish DIF 0.0922 DEA 0.0422 H 0.05 Bullish momentum accelerating" — gives that profile's own MACD line (DIF), signal line (DEA), histogram (H), direction, and momentum phase. Reading these four rows side by side is how you check whether agreement is genuinely broad or resting on one fast, noisy profile.
Key terms
Indicator definitions
What each term means in My Coin Trends, and why it matters when you're reading the widget.
| Term | Definition | Why it matters |
|---|---|---|
| Signal strength | A 0–100 score combining how many of the four profiles agree on direction, how many are accelerating, how long that agreement has held, and whether a crossover just fired — minus a penalty for any profile still pointing the other way. | One number to rank symbols by, but only a summary — the badges and per-profile rows above are where the real evidence lives. |
| Profile agreement | A simple count of how many of the four profiles currently read Bullish, Bearish, or Neutral, based on each profile's own reported direction. | 4/4 agreement across four different MACD speeds is meaningfully stronger evidence than one fast profile flipping on its own. |
| Momentum acceleration | A profile's histogram growing in the same direction it already points — magnitude increasing, not just staying positive or negative. | Distinguishes a move that is still gaining strength from one that has already peaked and is merely holding its current direction. |
Worked example
Walking through it
The arithmetic behind a Signal Strength score, using round numbers to keep the weights visible (the real screenshot's 88/100 follows the same formula).
- Agreement contributes up to 55 points
All four profiles agreeing on one direction earns the full 55; two profiles agreeing would earn roughly half that, scaled to how many agree out of four.
- Momentum contributes up to 20 points
Scaled the same way, by how many of the four profiles are currently accelerating rather than fading.
- Stability contributes up to 15 points
Scaled by the shortest same-direction streak among the four profiles, capped at 6 candles — a longer-held agreement earns more of these points.
- A fresh crossover adds 10 points
If any profile crossed its zero line within the last 3 candles, a flat 10-point bonus is added on top.
- Any opposing profile subtracts points
Points are deducted in proportion to how many of the four profiles disagree with the dominant direction — this is what keeps a 3-against-1 read from scoring as high as a clean 4-for-4.
The score rewards broad, accelerating, recently-stable agreement and penalizes disagreement — which is exactly why checking the four individual profile rows, not just the headline number, tells you whether a high score is built on solid or shaky ground.
Read this before you rely on it
Limitations and conflicting evidence
These derived statistics — signal strength, profile agreement, stability, and the event markers — are calculated by the app from the four profiles' raw values; they are a summarizing convenience, not a separate backend signal with its own independent evidence. MACD is a lagging indicator by construction, built from moving averages of past prices, so even a strong, stable, high-scoring read describes what has already happened, not a guarantee of what happens next. A market that chops sideways can still produce short-lived crossovers and brief accelerations on the fastest profile without the slower profiles ever confirming — which is precisely why the score rewards agreement across all four rather than any single profile's signal.
Go deeper
Related widget documentation
MACD Signal Insights
Connect market breadth, signal events, configured MACD profiles, price context, crossovers, stability, and strength on one timeline.
Open documentation →Market Confirmation Insights
Rank symbols where independent scanner, momentum, trend, participation, structure, and higher-timeframe evidence agree—and expose conflicts before a decision is made.
Open documentation →Risk notice
My Coin Trends provides market information and technical signals. It is not investment advice. Verify every signal against current market structure, liquidity, and your own risk limits before making a trading decision.This article is educational content describing how My Coin Trends' indicators work; it is not a recommendation to buy, sell, or hold any asset.