
Confluence
Market Pulse vs. Scanner Confluence: Why Two Tile Views Can Disagree
Both widgets show one coloured tile per coin and timeframe, so they are easy to mistake for the same thing. They answer different questions: Market Pulse checks whether the scanner and your MACD profiles agree right now, while Scanner Confluence shows what the scanner alone has mostly been saying.
By admin · Updated 02 October 2026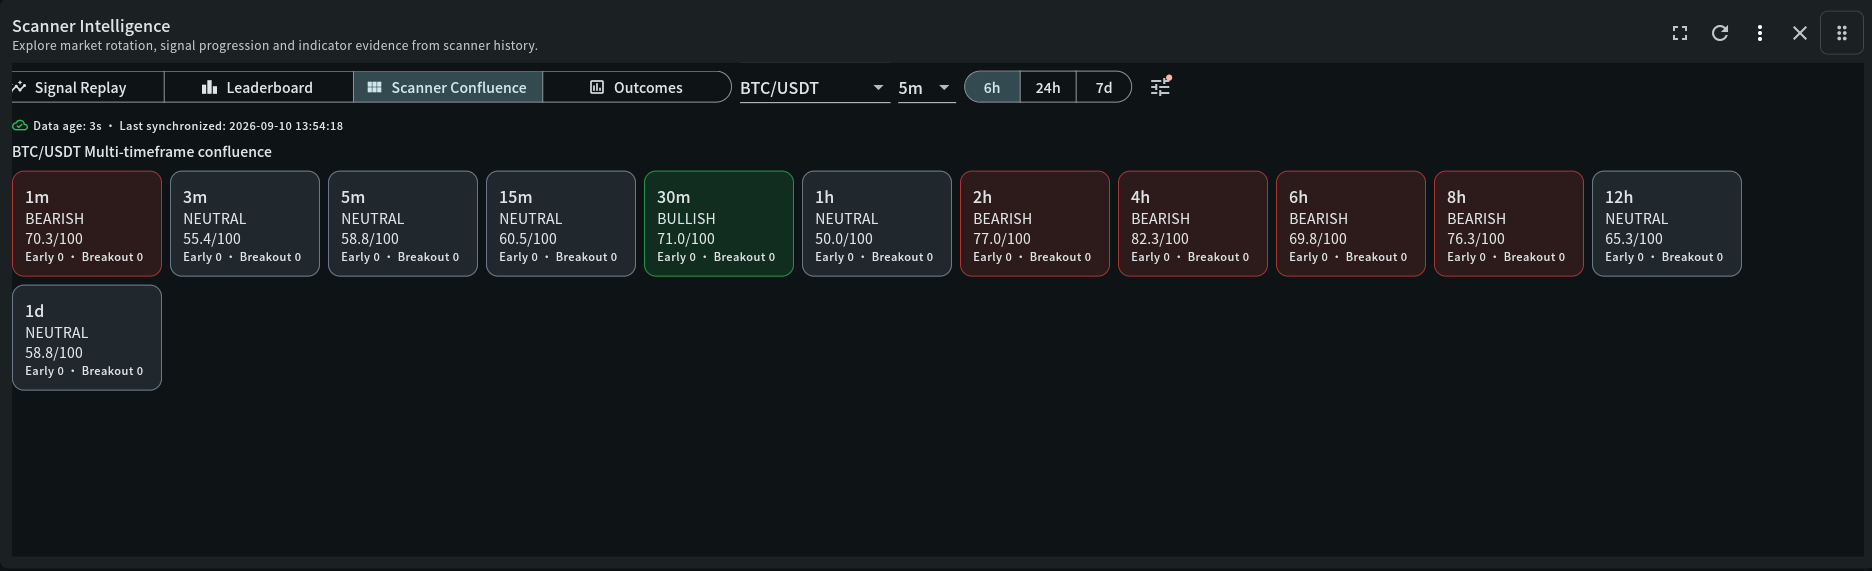
Screenshot, decoded
Reading this panel
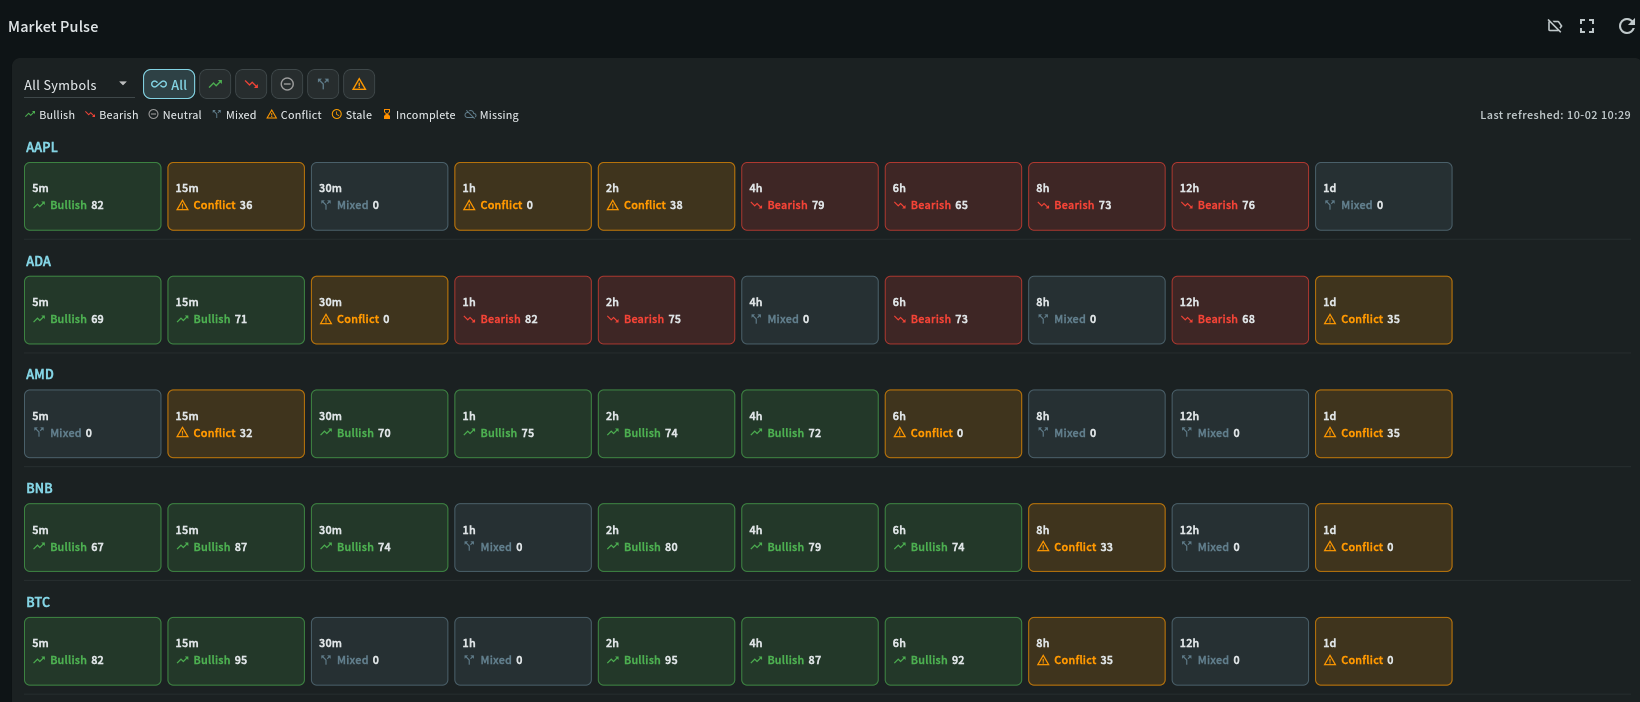
The first screenshot is Scanner Confluence and the second is Market Pulse, captured a few minutes apart with all coins shown. Both list the same coins with ten tiles each, from 5m to 1d. Compare the first row, AAPL, in the two screenshots.
Same layout, different controls
Scanner Confluence sits inside Scanner Intelligence, with window buttons (6h, 24h, 7d) and direction buttons for All, Bullish, Bearish and Neutral. Market Pulse has a coin selector and the same direction buttons plus two more, Mixed and Conflict.
What a tile contains
A Scanner Confluence tile has three lines: the timeframe, the direction with the scanner's confidence, and the Early and Breakouts counts. A Market Pulse tile has two: the timeframe, and the agreement state with its score.
Where the two agree — AAPL 4h, 6h, 8h and 12h
Both screenshots show Bearish 79, 65, 73 and 76 on these four tiles. When the scanner and MACD point the same way, Market Pulse shows the same direction and the same number as Scanner Confluence.
Where they differ — AAPL 1h and 2h
Scanner Confluence shows Bearish 66 and Bearish 75. Market Pulse shows Conflict 0 and Conflict 38 in amber. The scanner reads bearish on both timeframes, but the MACD profiles do not agree, so Market Pulse will not call them bearish.
Neutral is not the same as Mixed — AAPL 30m and 1d
Scanner Confluence shows Neutral 58 and Neutral 61: the scanner sees no clear direction. Market Pulse shows Mixed 0: MACD points one way but the scanner is Neutral, so the two do not line up; the tile adds MACD's side as an arrow (a green ▲ for bullish, a red ▼ for bearish; the tile itself stays grey). Both are grey tiles, but they come from different checks.
States only Market Pulse has
Its legend also lists Stale, Incomplete and Missing, used when a source is too old or not fully available for that tile. Scanner Confluence reports freshness once for the whole view, in the "Data age" line.
Early and Breakouts counts
Only Scanner Confluence shows them — "Early 0 · Breakouts 0" on most tiles here. They count the early warnings and breakouts the scanner raised on that timeframe in the selected window.
Key terms
Indicator definitions
What each term means in My Coin Trends, and why it matters when you're reading the widget.
| Term | Definition | Why it matters |
|---|---|---|
| Alignment | Whether two independent sources point the same way at the same moment. | Agreement between independent sources is stronger evidence than one source repeating itself. This is what Market Pulse measures. |
| Confluence | Several readings from the same source, across timeframes or over time, pointing the same way. | It shows how consistent the scanner has been, and whether short and long timeframes tell the same story. This is what Scanner Confluence measures. |
| Mixed / Conflict | Market Pulse states meaning the scanner and the MACD profiles do not line up, or directly disagree. | A Conflict tile is a warning that a trend read is not supported by momentum. Scanner Confluence cannot show this, because it has only one source. |
| Majority direction | The direction most scanner readings pointed during the recent period. | It smooths out a single noisy reading, at the cost of reacting slightly later to a fresh change. |
Worked example
Walking through it
Read straight from the AAPL row of the two screenshots above.
- Scanner Confluence, AAPL 1h: Bearish 66
Most of the scanner's recent readings on the 1-hour timeframe were bearish, with moderate confidence.
- Market Pulse, AAPL 1h: Conflict 0
On the same timeframe the MACD profiles do not support the scanner's bearish read, so the tile is amber with a score of 0.
- Compare with AAPL 4h: Bearish 79 in both
Here the scanner and MACD agree, and both widgets show the same direction and the same number. That is what a confirmed read looks like.
- How to read the whole row
From 4h to 12h the bearish read is confirmed by both views. On 1h and 2h the scanner is bearish but momentum has not confirmed it, so those timeframes are unconfirmed, not bearish.
Use Scanner Confluence to see what the scanner has been saying across timeframes and whether events are building. Use Market Pulse to see whether MACD backs that read right now. Matching tiles are the strongest case; a difference between them is information, not an error.
Read this before you rely on it
Limitations and conflicting evidence
Neither view is a trade instruction. The numbers quoted are from the moment the screenshots were taken and will differ in your app. Market Pulse depends on your active MACD preset, so two users with different presets can see different tiles for the same coin. Scanner Confluence summarises a recent period, so it can take a little longer to reflect a fresh change of direction.
Go deeper
Related widget documentation
Market Pulse
Two tabs in one section: Market Pulse maps Trend/MACD alignment for every symbol and timeframe (Summary and Heat map, with bullish, bearish, neutral, mixed and conflict filters), and MACD Signal Insights connects market breadth, signal events and each configured MACD profile on one timeline.
Open documentation →Scanner Intelligence
Investigate market rotation, opportunity progression, multi-timeframe confluence, replay evidence, and measured trade outcomes in one connected workspace.
Open documentation →Risk notice
My Coin Trends provides market information and technical signals. It is not investment advice. Verify every signal against current market structure, liquidity, and your own risk limits before making a trading decision.This article is educational content describing how My Coin Trends' indicators work; it is not a recommendation to buy, sell, or hold any asset.