
Scanner Intelligence
How to Actually Use Scanner Intelligence's Signal Replay (Not Just Look at It)
A practical, step-by-step operating guide to Signal Replay — checking freshness, driving the crosshair, reading event markers, and following a signal from raw evidence to conclusion.
By admin · Updated 10 September 2026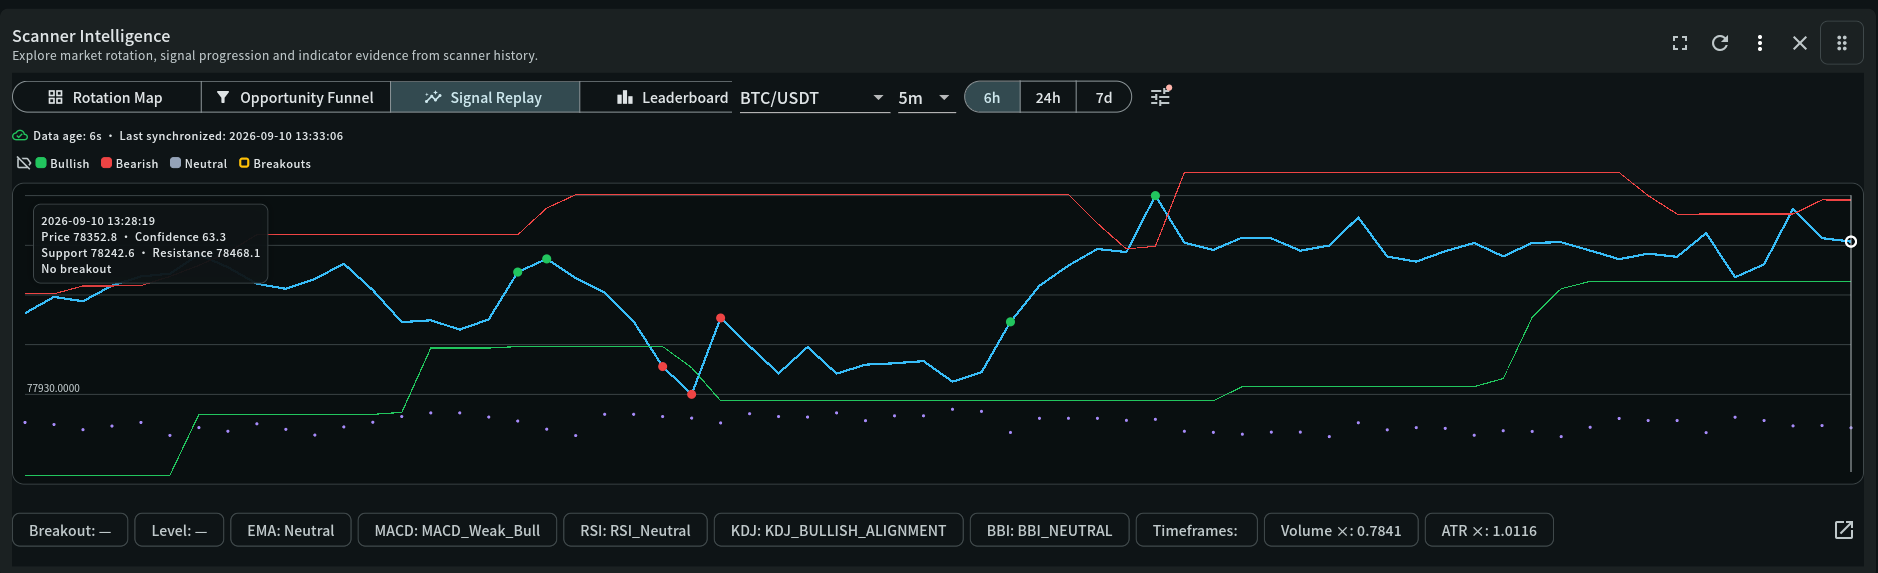
Screenshot, decoded
Reading this panel
A practical operating tour of the same Signal Replay view, in the order you would actually use it — not just what each element means, but what to do with it.
Step 1 — Check the freshness row first
"Data age: 6s · Last synchronized: 2026-09-10 13:33:06" with a green cloud icon means this reflects the live market. Always check this before reading anything else — a stale reading undermines every field that follows it.
Step 2 — Set your scope
Symbol (BTC/USDT), timeframe (5m), and period (6h / 24h / 7d) define the whole window you are about to investigate. Start with a shorter period for a focused look, and widen it if you need more history for context.
Step 3 — Scan the chart for event markers, not the current price
Green and red dots along the price line are past bullish and bearish evidence — these are your investigation targets. Resist the urge to only look at the rightmost (most recent) point; a marker from earlier in the window can still be relevant context.
Step 4 — Move the crosshair to a marker
Dragging or tapping the crosshair onto any point in the chart — a marker or otherwise — opens the tooltip for that exact moment: timestamp, price, confidence, support, resistance, and breakout state, shown here as "2026-09-10 13:28:19 / Price 78352.8 · Confidence 63.3 / Support 78242.6 · Resistance 78468.1 / No breakout".
Step 5 — Read the evidence bar for that same moment
Breakout, Level, EMA, MACD, RSI, KDJ, BBI, Timeframes, Volume ×, and ATR × all update to describe the exact point your crosshair is on — this is the full, multi-indicator picture for that one moment, not a separate live reading.
Step 6 — Compare, do not conclude from one point
Move the crosshair between several markers to see how the evidence changed leading up to each one. A single strong-looking moment means less than a pattern of strengthening evidence across several.
Key terms
Indicator definitions
What each term means in My Coin Trends, and why it matters when you're reading the widget.
| Term | Definition | Why it matters |
|---|---|---|
| Freshness (data age) | How long ago the displayed data was last synchronized from the live market. | The single most important thing to check first — every other field in Signal Replay is only as trustworthy as this. |
| Crosshair tooltip | A snapshot of every tracked field — price, confidence, support, resistance, breakout state — for the exact point in time the crosshair is positioned on. | The mechanism that turns a static chart into an investigable one: every past moment is inspectable, not just the current candle. |
| Event marker | A colored dot placed directly on the price line marking a past bullish or bearish observation. | Your starting points for investigation — scan for these first, then use the crosshair to read the full context behind each one. |
Worked example
Walking through it
A realistic investigation sequence using the exact screenshot above as the anchor point.
- Confirm freshness
Data age of 6 seconds with a recent synchronization timestamp — safe to proceed.
- Spot a marker
A red (bearish) dot appears on the price line around the point the crosshair is currently reading.
- Read the tooltip at that marker
Price 78352.8, Confidence 63.3, Support 78242.6, Resistance 78468.1, No breakout — price is between the levels, so this bearish marker reflects momentum evidence, not a structural break.
- Cross-check the evidence bar
EMA Neutral, MACD Weak Bull, RSI Neutral, KDJ Bullish Alignment, BBI Neutral, Volume 0.78×, ATR 1.01× — a genuinely mixed picture: the bearish marker does not have broad indicator agreement behind it at this exact moment.
- Conclusion for this point
A single bearish marker with mixed, unexpanded supporting evidence and no active breakout is a moment to note, not to act on — exactly the kind of read that needs more confirmation before it means anything on its own.
Signal Replay's value is in the sequence — freshness, then markers, then crosshair detail, then cross-checking the evidence bar — not in any single number on the page.
Read this before you rely on it
Limitations and conflicting evidence
Signal Replay shows evidence, not instructions — even a moment with strong, broadly-agreeing evidence is a prompt for further investigation, not an entry signal. Support and resistance levels shown at a past crosshair position were correct for that moment, but may have since shifted as new candles formed — do not assume a level from earlier in the window is still current. Like every view in Scanner Intelligence, Signal Replay is only as reliable as its freshness; treat a stale reading as historical reference, not current evidence.
Go deeper
Related widget documentation
Scanner Intelligence
Investigate market rotation, opportunity progression, multi-timeframe confluence, replay evidence, and measured trade outcomes in one connected workspace.
Open documentation →Market Confirmation Insights
Rank symbols where independent scanner, momentum, trend, participation, structure, and higher-timeframe evidence agree—and expose conflicts before a decision is made.
Open documentation →Risk notice
My Coin Trends provides market information and technical signals. It is not investment advice. Verify every signal against current market structure, liquidity, and your own risk limits before making a trading decision.This article is educational content describing how My Coin Trends' indicators work; it is not a recommendation to buy, sell, or hold any asset.