
Scanner Intelligence
Bullish Breakout or Bearish Breakdown? Reading the Confirmation Markers on the Timeline
"Breakdown" is just the bearish half of the same breakout mechanism — this walkthrough of a real Scanner Signal Insights timeline shows exactly which markers separate a genuine structural break from noise.
By admin · Updated 09 September 2026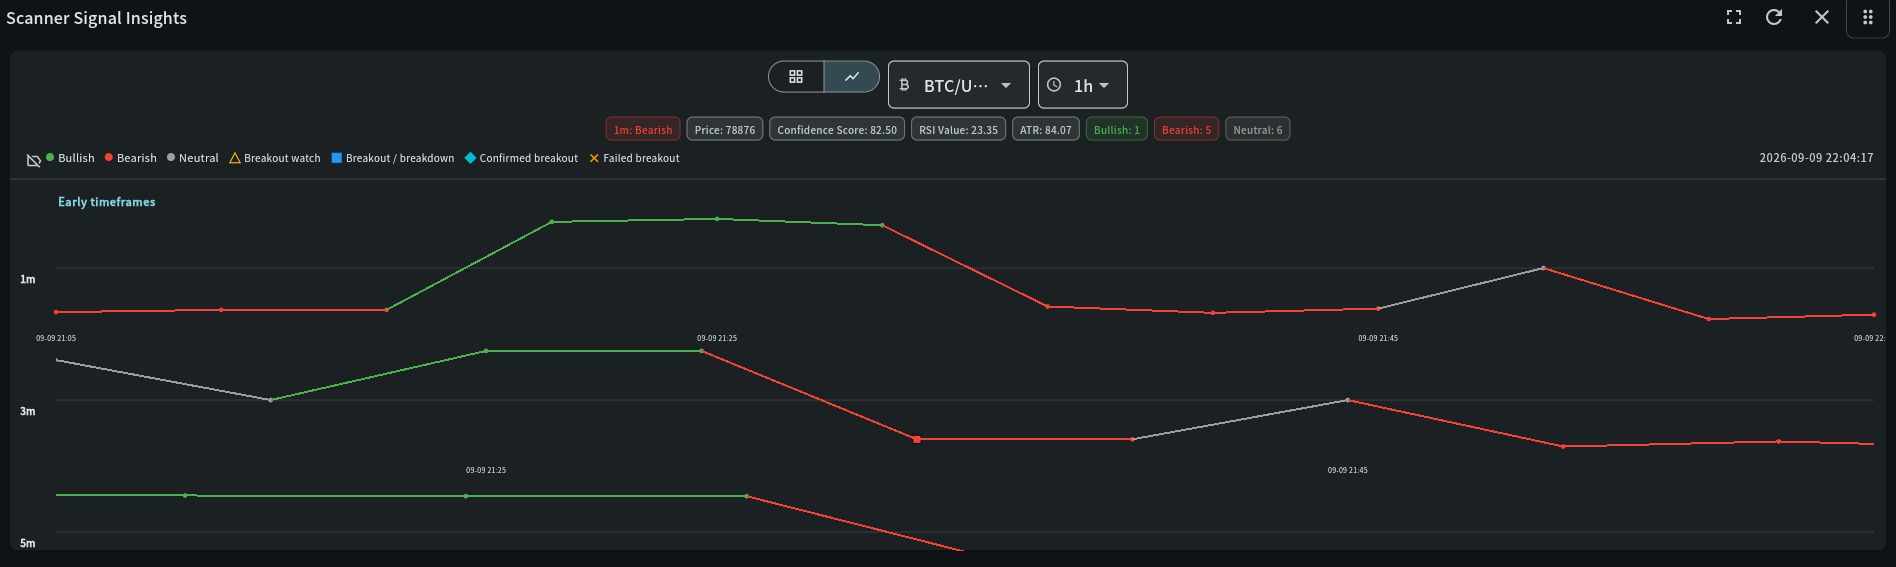
Screenshot, decoded
Reading this panel
This is a real Scanner Signal Insights timeline for BTC across several timeframes at once. Here is what each control, readout, and marker means.
View toggle and controls
Switches between a grid summary and this timeline view. Symbol and timeframe controls (BTC/U…, 1h here) scope the top readout; the timeline itself shows several timeframes at once, each on its own row.
Top readout — direction, price, confidence, RSI, ATR
"1m: Bearish" is the current directional read for the fastest row. Price, Confidence Score, RSI Value, and ATR are plain, current values for that reading — not further transformed, so you can cross-check them directly against what you would expect from the raw indicator.
Bullish / Bearish / Neutral counts
A tally of recent observations by direction within the current view. Here, 5 bearish observations against 1 bullish and 6 neutral gives you the broad lean before you even look at the lines below.
Legend — marker shapes
Breakout watch (triangle) marks price approaching a level. Breakout / breakdown (square) marks a level actually broken. Confirmed breakout (diamond) marks a break that gathered enough independent agreement to be trusted. Failed breakout (X) marks a break that reversed back inside the level. The same four shapes apply whether the move is bullish (breakout) or bearish (breakdown) — there is no separate breakdown mechanism underneath.
Per-timeframe rows and colored segments
Each row is one timeframe; the line color at any point shows that timeframe's direction at that moment — green for bullish, red for bearish, grey for neutral. Reading several rows together is how you check whether a break on one fast timeframe has any support from the slower ones.
Key terms
Indicator definitions
What each term means in My Coin Trends, and why it matters when you're reading the widget.
| Term | Definition | Why it matters |
|---|---|---|
| Breakout (bullish) | Price closes above a resistance level by more than a small noise buffer. | Real structural evidence on its own, but only one signal until it either fails or confirms. |
| Breakdown (bearish) | The same mechanism as a breakout, applied to price closing below a support level. | There is no separate detection logic for a bearish move — it is evaluated by exactly the same watch/break/confirm/fail progression as a bullish one, which keeps the standard consistent in both directions. |
| Breakout watch | Price is approaching a real level closely enough to be worth attention, before it has actually broken through. | An earlier, softer stage than a break — useful for narrowing your attention, not for acting on. |
| Failed breakout | A break that later closed back inside the level it had broken, invalidating the move. | The reason a raw break alone is never sufficient evidence — a meaningful share of breaks end up here instead of confirming. |
Worked example
Walking through it
Illustrative progression of a single bearish breakdown, mirroring the confirmed-breakout process exactly, not a live signal.
- Breakdown Watch
Price approaches a known support level from above, and existing momentum evidence already leans bearish.
- Breakdown
Price closes below the support level by more than the noise buffer — a real, single-timeframe structural break.
- Confirmation check
The same checklist applies as for a bullish breakout: a high confidence score, agreement from other timeframes, real volume or volatility expansion, and momentum/trend indicators pointing the same (bearish) way.
- Confirmed breakdown — or failed
If every condition lines up, it is marked Confirmed. If price instead closes back above the support level first, it is marked Failed, regardless of how convincing the initial break looked.
Whichever direction you are watching, the question is identical: did the break get independent confirmation, or did it fail? Treat "breakdown" as a label for direction, not a different, separately-validated kind of signal.
Read this before you rely on it
Limitations and conflicting evidence
The exact aggregate Bullish/Bearish/Neutral counts shown in the readout describe recent observations within the current query window, not a fixed, universal lookback — comparing counts between two different symbols or timeframes is less meaningful than watching how one symbol's own counts shift over time. RSI and ATR shown here are single, current-candle values; a single reading can be noisy, so weight it alongside the direction lines and marker history rather than in isolation. As with any breakout classification, thresholds are tuned defaults — they can be too strict for a quiet market or too loose for a highly volatile one.
Go deeper
Related widget documentation
Scanner Signal Insights
Read a concise event timeline of scanner trend changes, indicator tags, price, ATR, and RSI context.
Open documentation →Scanner Intelligence
Investigate market rotation, opportunity progression, multi-timeframe confluence, replay evidence, and measured trade outcomes in one connected workspace.
Open documentation →Risk notice
My Coin Trends provides market information and technical signals. It is not investment advice. Verify every signal against current market structure, liquidity, and your own risk limits before making a trading decision.This article is educational content describing how My Coin Trends' indicators work; it is not a recommendation to buy, sell, or hold any asset.