Features Standard

Market Forecast

Compare experimental future-price estimates and direction probabilities for your own symbols across 30m, 1h and 4h. Read every estimate with its target time, uncertainty and evidence status—not as a trade instruction.

Availability

Standard

Use this widget with its linked state records, your selected timezone, and independent risk management. A signal or chart does not guarantee a trade outcome.

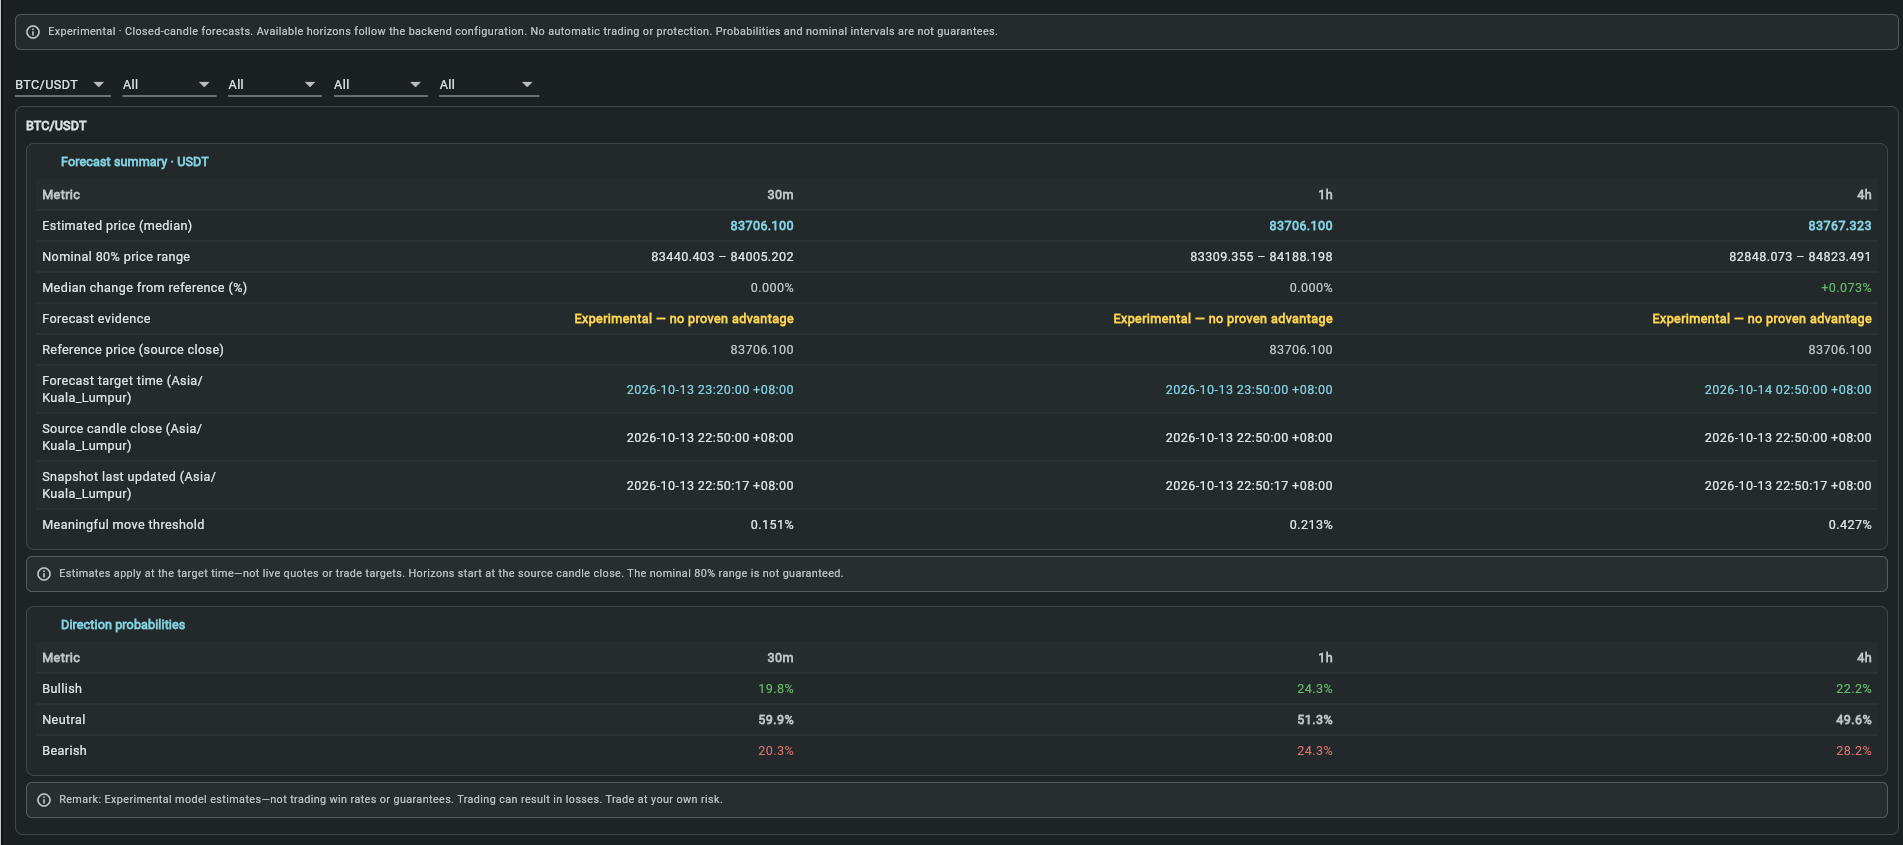
Market Forecast summary and Direction probabilities comparing BTC/USDT across 30m, 1h and 4h in English
Captured summary view. Prices, probabilities and timestamps illustrate the interface; they are not live market readings.Open full-size screenshot ↗

Step-by-step use

Market Forecast

Compare experimental future-price estimates and direction probabilities for your own symbols across 30m, 1h and 4h. Read every estimate with its target time, uncertainty and evidence status—not as a trade instruction.

  1. 1
    1. Choose the view

    Sign in and open Dashboard → Analyze → Market Forecast. If hidden, enable it in Settings → Dashboard widgets. Select one of your own symbols or All.

  2. 2
    2. Review the context

    Compare the estimated median price, nominal 80% range and reference price. Forecast target time is directly below Reference price; it uses your selected timezone.

  3. 3
    3. Continue your review

    Read all three direction probabilities, their meaningful move threshold, evidence status and source freshness. Use How to read for guidance; observation never places or changes trades.

Recommended attention order

What to review first

Market Forecast gives every signed-in user experimental estimates for their own assigned symbols. Read each price with its future target time and evidence status; this is observation, not a trading instruction.

Your symbol → target time → estimated price and range → direction probabilities → evidence and freshness

  1. Compare the same symbol

    Use All horizons to compare available forecast windows side by side. Filters and pagination change the display, not calculations or trades.

  2. Read price with target time

    Estimated price (median) appears first; Forecast target time is directly below Reference price. The median estimates the price at that target time, not the next tick or a take-profit. The horizon starts at the source candle close. Times use your selected timezone.

  3. Read uncertainty and direction

    Direction probabilities are available to all signed-in users for their own symbols. The nominal 80% range is not guaranteed. Bullish, neutral and bearish probabilities describe movement beyond or within the meaningful move threshold, not your chance of winning a trade. Remark: Experimental model estimates—not trading win rates or guarantees. Trading can result in losses. Trade at your own risk.

  4. Check evidence and freshness

    Experimental — no proven advantage means the evidence has not established an advantage over simple benchmarks. Collecting validation evidence means more observations are needed. Missing or stale estimates show dashes, never zero.

  5. Read direction and the Promising grade

    Direction: compare Bullish with Bearish. If they are about equal (for example 30% and 30%), there is no direction—only a chance of a bigger move either way. A lean needs one side clearly larger than the other. Neutral is usually the largest because small moves are the most common. Read the 80% range as expected volatility, not as a price target or take-profit level. "Promising research evidence" grades the model, not the market: it beat the frequency benchmark on unseen past data. It is not a bullish signal and does not mean the next move will be right. Use the forecast as context next to your trade signals—for expected volatility and, when a Promising horizon clearly leans, direction—never as a buy or sell instruction on its own.

How to read this widget

Market Forecast

Use these points to interpret the visible values before moving to a related record or decision.

Who can see what

All signed-in users can view the summary and Direction probabilities for their own assigned symbols. The symbol dropdown and filters cannot reveal another user’s symbols. Administrator/SubAdmin additionally retain the full Forecast, Trade Risk and Validation views; internal diagnostics and paper-book details are not included in the ordinary-user summary.

Read the summary in its displayed order

Estimated price (median) comes first, followed by the nominal 80% price range, median change from reference, forecast evidence/reliability status, Reference price (source close), then Forecast target time immediately below Reference price. The summary-only view also shows source candle close, snapshot update time and the meaningful move threshold. Each horizon has its own column; prices use the quote currency in the heading. The reference is a past close, not a live quote. For illustration only, a reference of 100 and estimated median of 101 produce a +1.000% median change; this is not a current market forecast.

Target time, timezone and freshness

The 30m, 1h or 4h horizon starts at the source candle close—not when you open or refresh the widget. A source close at 10:00 UTC gives a 30m target at 10:30 UTC; both display in the timezone selected in Settings, with the offset appropriate to each instant, including daylight-saving changes. The estimate describes the price at the target time, not the highest or lowest price on the way. Snapshot update time is not proof of source freshness. Missing, stale or invalid forecasts show unavailable values rather than invented prices or zero probabilities.

Direction probabilities and their remark

Direction probabilities are available to every signed-in user for their own symbols. Bullish means a rise beyond the meaningful move threshold; Neutral means movement within it; Bearish means a fall beyond it, all relative to the source-close reference. Green, muted and red distinguish the three classes. Read all three: rounded values total approximately 100%, a tied leader is Mixed, and a 40% leader is still below a majority. These are model estimates, not trade win rates. The risk remark appears immediately below the direction table.

Evidence is not a confidence guarantee

Experimental — no proven advantage means the checks have not established an advantage over simple benchmarks. Collecting validation evidence means more measured observations are needed. Neither status is trading approval. Even support for paper monitoring does not guarantee future accuracy or profitability. A nominal 80% range is a model interval, not guaranteed coverage; complete historical inputs do not establish predictive accuracy. Keep the evidence status and freshness warnings visible when interpreting estimates.

Filters, pagination and higher timeframes

Use symbol, horizon, direction, minimum probability and availability filters to narrow the summary. All horizons compares independent estimates side by side; the values are not averaged. Pagination offers 10, 25 or 50 symbol groups per page, keeping each symbol’s horizons together. On a narrow screen, scroll horizon values horizontally while metric labels stay visible. Filters do not retrain models or change trading. Additional forecast horizons appear only when the backend supports and supplies them; Weekly, Daily and 12h historical context is not automatically a forecast horizon.

Administrator/SubAdmin evidence stays separate

Privileged users can expand Forecast details for research checks, published-outcome reliability, closed higher-timeframe context and paper-book associations. Trade Risk compares frozen reference, stop and target prices with uncalibrated historical analogue rates; these are not an open trade’s calibrated win/loss probabilities or protection. Rolling V2 book evidence is separate from each individual trade. Validation separates held-out tests, walk-forward folds, calibration and actual published forward outcomes, with samples, baselines, failure reasons and incomplete-refresh indicators. Paper observation follows the configured live book while reference and previously observed books remain separate; no trading setting is changed by viewing these reports.

Risk and responsible interpretation

Remark: Experimental model estimates—not trading win rates or guarantees. Trading can result in losses. Trade at your own risk.

Field reference

What each value means

Use these definitions to interpret the widget consistently across cryptocurrency and stock markets.

FieldMeaningPractical use
Target time / estimated price / rangeFuture target time, median price estimate and nominal 80% interval, in the displayed quote currency.Compare the target time across horizons. The range is not guaranteed and the median is not a live quote.
Reference price / median changeSource-close price and percentage change from that price to the estimated median.The reference is historical, not the current market price.
Bullish / Neutral / Bearish / meaningful move thresholdProbabilities of rising beyond, remaining within, or falling beyond the displayed percentage threshold.Read all three; a tie is mixed. These probabilities are not trade win rates.
Forecast evidence / source close / snapshot updatedEvidence status and the timestamps anchoring the estimate, in your selected timezone.Evidence that is still collecting or has no proven advantage is experimental. Refresh stale data before relying on it; missing values are unknown.

Cryptocurrency markets

Closed-candle estimates can be disrupted by news, liquidations and liquidity changes. Observation only; no trading or protection is automated.

Stock markets

For stock-linked symbols, check feed freshness and exchange sessions. Reopening gaps and scheduled events can invalidate estimates.

Risk notice

My Coin Trends provides market information and technical signals. It is not investment advice. Verify every signal against current market structure, liquidity, and your own risk limits before making a trading decision.